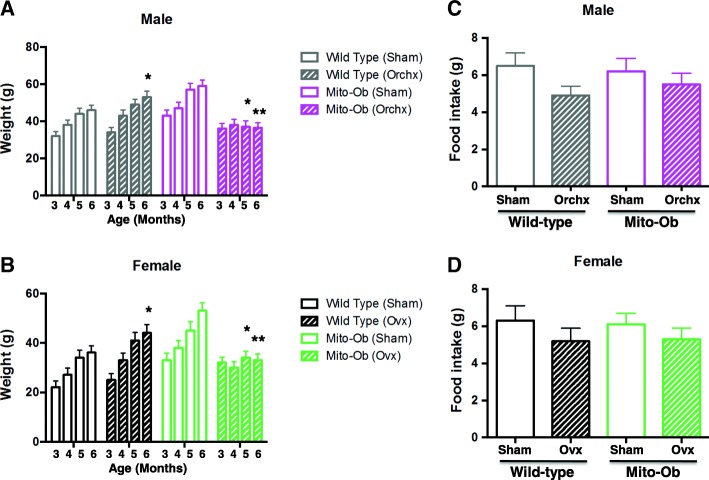
Fig. 1.
Left panel: Histograms showing the effect of gonadectomy on the body weight of a male Mito-Ob mice and b female Mito-Ob mice. Age- and sex-matched sham-operated Mito-Ob mice and wild-type mice are shown as controls. Data are presented as mean ± SEM (n = 8). *p < 0.05 and **p < 0.01 indicate age- and sex-matched gonadectomized mice vs sham-operated control within each experimental group. Right panel: Histograms showing the effect of gonadectomy on the food intake in c male Mito-Ob mice and d female Mito-Ob mice. Age- and sex-matched sham-operated Mito-Ob mice and wild-type mice are shown as controls. Data are presented as mean ± SEM (n = 6). No significant difference was found between sham-operated control and gonadectomized mice within each experimental group. Ovx—ovariectomy; Orchx—orchiectomy

