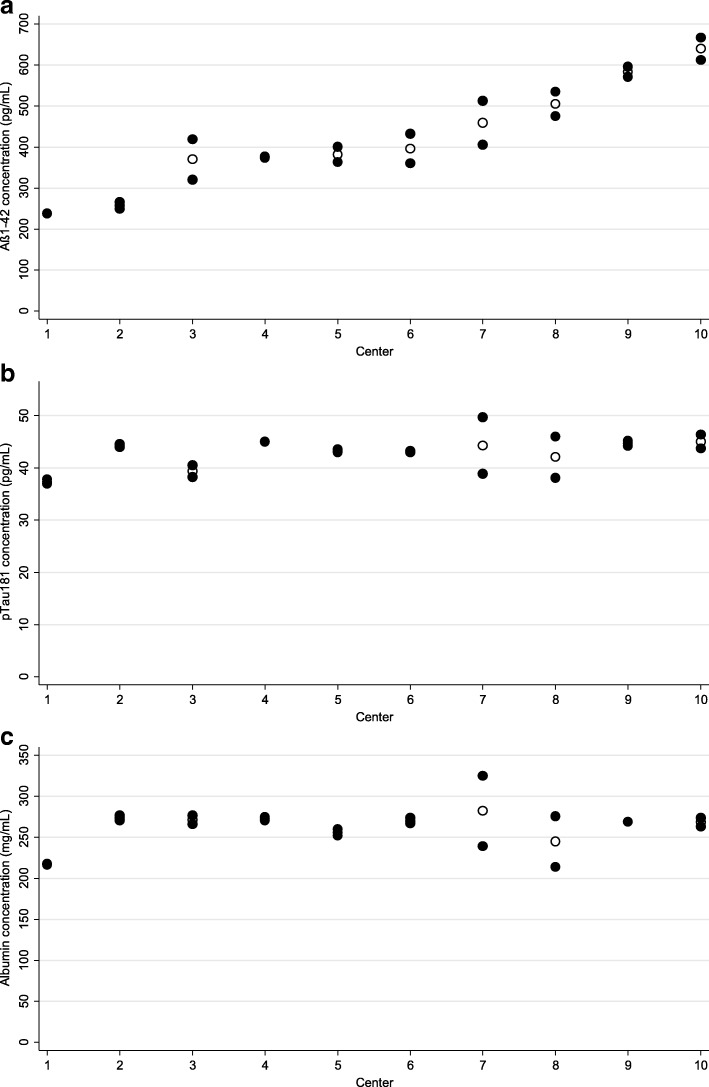
Fig. 3.
Results of interlaboratory processing scheme, for analytes of interest: Aβ1–42 (a), pTau181 (b), and albumin (c). Concentrations obtained in aliquots prepared by a given laboratory from primary sample presented as filled circles; laboratory-specific averages presented as hollow circles. Aβ amyloid beta

