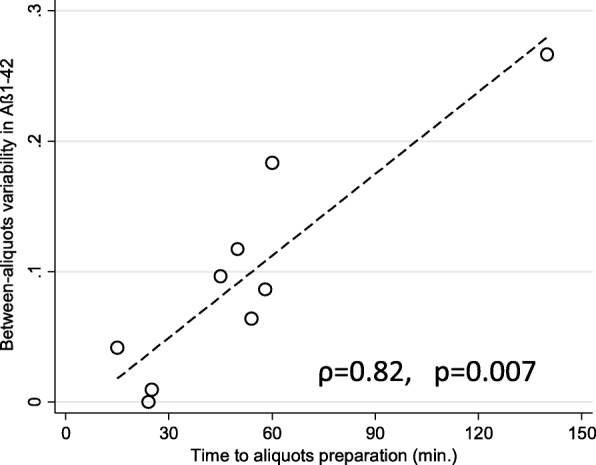
Fig. 4.

Correlation of variability between Aβ1–42 concentrations measured in two aliquots prepared by a given laboratory and duration of preparation of these aliquots. Variability expressed as absolute difference between concentrations in the two aliquots prepared by a given laboratory divided by average of these two concentrations. Aβ amyloid beta
