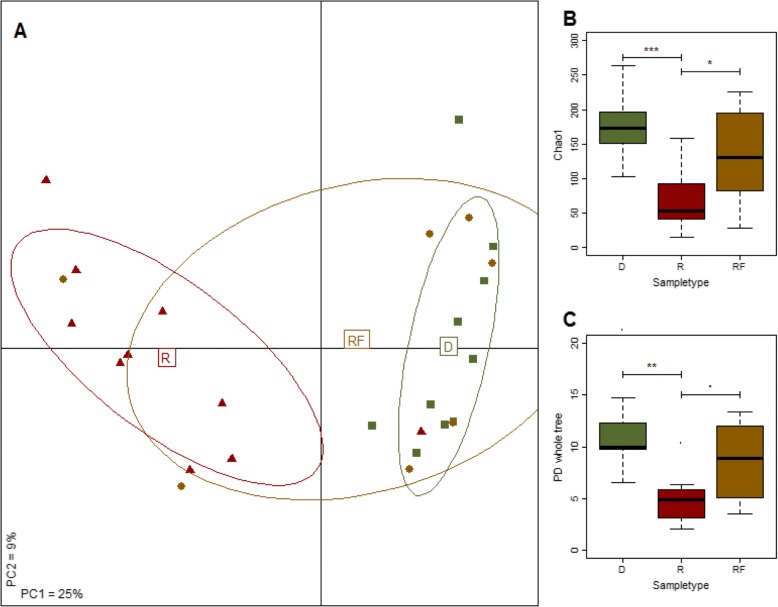
Fig. 1.
FMT restores the microbiota to a more donor-like profile. a: Overall the microbiota composition is more similar to the donor microbiota after FMT compared to before transplant. Shown is the PCoA (unweighted UniFrac distance) of the microbiota associated with CDI (“R”, n = 10), post-FMT (“RF”, n = 7) as well as FMT-donors (“D”, n = 10). The tenth sample can be found in the bottom-right part of the PCoA overlaping one of the RF samples. The microbiota prior to FMT is statistically significantly different, compared to the microbiota of donors (P < .001, F-statistic = 4.96, PERMANOVA), but assumes a more donor-like profile after FMT (P > .1, F-statistic = 1.22 for “RF” vs “D”). b and c: FMT leads to partial recovery of bacterial α-diversity. Shown, are box-and-whisker plots for the Chao1 index (b) and the phylogenetic diversity (PD whole tree) (c). Similar results were obtained for three other measures of bacterial α-diversity (Shannon- and Simpson-index, observed species). ‘***’ P < .001; ‘**’ P < .01; ‘*’ P < .05; ‘.’ P < .1

