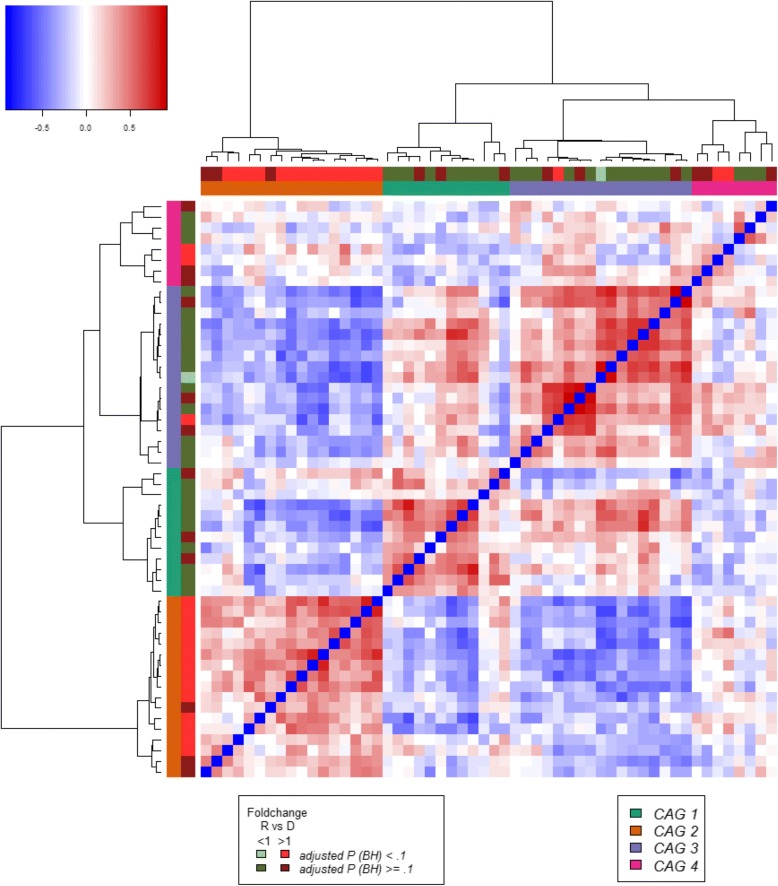
Fig. 2.
Hierarchical Ward-linkage clustering based on the correlation coefficients determined by SparCC. Co-abundance groups were defined on the basis of the clusters in the vertical tree. Colour coding of side bars: Co-abundance groups are coloured according to the legend at the bottom-right. Fold-change and statistical significance are coloured according to the legend at the bottom-left. Colour coding of the side bars according to the legends below. The composition of each Co-abundance Group is shown in Additional file 1: Figure S2

