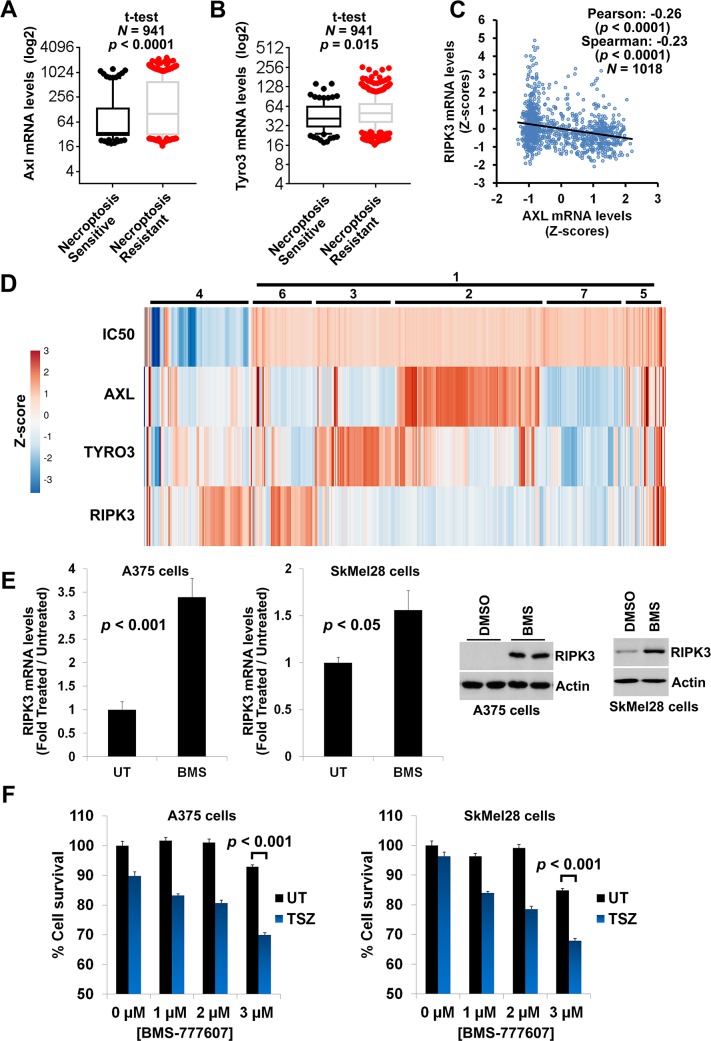
Fig 3. AXL overexpression in cancer cell lines correlates with loss of RIPK3 expression and gain of necroptosis resistance.
(A) High AXL expression levels are enriched in cancer cell lines fully resistant to necroptosis. GDSC database was employed for the analysis. Means, 10–90 percentile data points ± SEM are shown with t test p-values. (B) High TYRO3 expression levels are enriched in cancer cell lines fully resistant to necroptosis. GDSC database was employed for the analysis. Means, 10–90 percentile data points ± SEM are shown with t test p-values. (C) High AXL expression predicts low RIPK3 expression levels. GDSC database was employed for the Pearson and Spearman correlation analyses. (D) High AXL/TYRO3 expression positively correlates with low RIPK3 expression and high TSZ-IC50 levels (resistant to necroptosis). Heatmap showing clustering of z-score values for TSZ-IC50 versus AXL, TYRO3, and RIPK3 expression levels across 941 cell lines. Numbers indicate clusters described in the text. (E) Inhibition of AXL in cancer cell lines can rescue loss of RIPK3 expression. qRT-PCR and western blotting analysis of RIPK3 expression in A375 and SkMel28 cell lines following 4 days of AXL inhibition by 1 μM of BMS-777607. These cell lines were selected because they did not show significant cell death following treatment with this inhibitor. (F) Inhibition of AXL in cancer cell lines can rescue loss of necroptosis sensitivity. A375 and SkMel28 cells were treated with indicated concentrations of BMS-777607 for 4 days. Drugs were washed out and necroptosis was induced by 24 h treatment with 25 ng/mL TNFα + 0.5 μM SM-164 + 30 μM zVAD.fmk. Cell survival was determined using CellTiterGlo assay. The underlying data can be found in S1 Data. GDSC, Genomics of Drug Sensitivity in Cancer; qRT-PCR, quantitative real-time PCR; TSZ, TNFα+SM-164+zVAD.fmk; UT, untreated.

