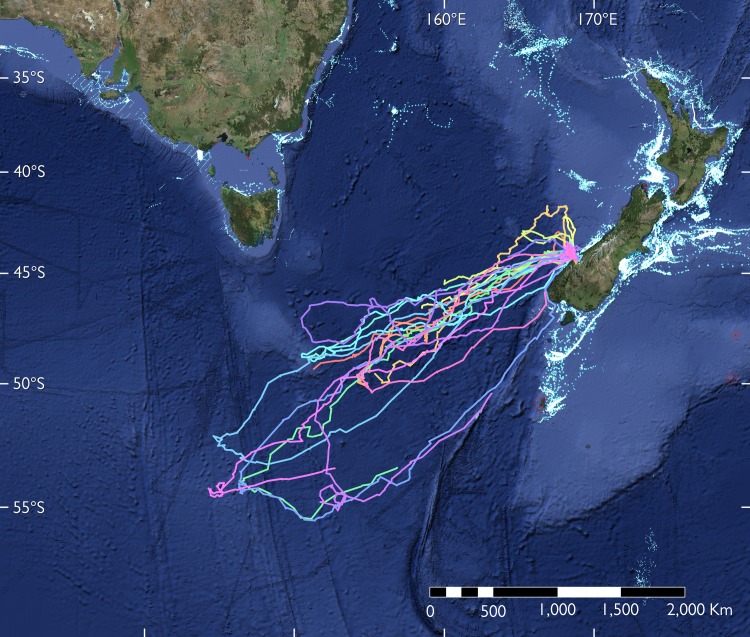
Fig 6. Commercial fishing activity in relation to Tawaki pre-moult dispersal.
Light blue to white areas indicate regions with intense fisheries activities during the four months from November 2016 to February 2017. Fishing activity data were sourced from Global Fishing Watch (http://globalfishingwatch.org/map/).

