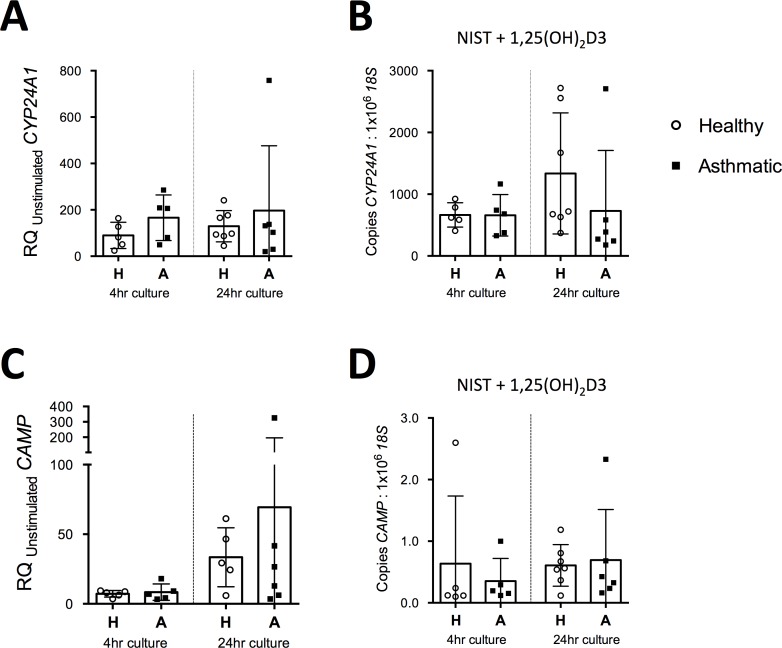
Fig 4. Comparison of expression of vitamin D axis genes between HBECs from healthy and asthmatic donors.
(A) Induction of CYP24A1 by NIST with 100nM 1,25(OH)2D3, relative to the unstimulated control condition, in 4 hour and 24 hour HBEC cultures. H, Healthy donor HBECs; A, Asthmatic donor HBEC cultures. 4hr healthy, n = 5; 4hr asthmatic, n = 5; 24hr healthy, n = 7; 24hr asthmatic, n = 6.(B) Expression of CYP24A1 as measured by qPCR relative to 18S in 4 hour and 24 hour HBEC cultures stimulated with 50μg/ml NIST and 100nM 1,25(OH)2D3. 4hr healthy, n = 5; 4hr asthmatic, n = 5; 24hr healthy, n = 7–8; 24hr asthmatic, n = 6. (C) Induction of CAMP by NIST with 100nM 1,25(OH)2D3, relative to the unstimulated control condition, in 4 hour and 24 hour HBEC cultures. 4hr healthy, n = 5; 4hr asthmatic, n = 5; 24hr healthy, n = 5; 24hr asthmatic, n = 6. (D) Expression of CAMP as measured by qPCR relative to 18S in 4 hour and 24 hour HBEC cultures stimulated with 50μg/ml NIST and 100nM 1,25(OH)2D3. 4hr healthy, n = 5; 4hr asthmatic, n = 5; 24hr healthy, n = 7; 24hr asthmatic, n = 6.

