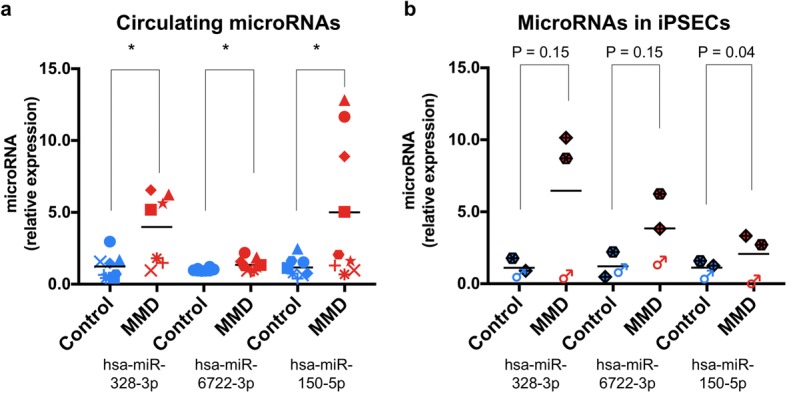
Fig. 4.

Quantification of microRNA expression in the plasma and iPSECs. a Column scatter graphs demonstrating relative plasma-microRNA expression levels for hsa-miR-328-3p (left), − 6722-3p (middle), and 150-5p (right), quantified by real-time PCR in the non-twin cohort (MMD n = 9; red dots, control n = 8; blue dots). There was a significant difference in each plasma-microRNA expression level between MMD and control groups (hsa-miR-328-3p, 4.0 ± 0.9 and 1.2 ± 0.3, p = 0.011; hsa-miR-6722-3p, 1.4 ± 0.1 and 1.0 ± 0.03, p = 0.049, hsa-miR-150-5p, 5.0 ± 1.6 and 1.2 ± 0.2, p = 0.043, respectively. *p < 0.05). Data represent the mean ± SEM. b Column scatter graphs demonstrating relative iPSEC-microRNA expression levels for hsa-miR-328-3p (left), − 6722-3p (middle), and 150-5p (right), quantified by real-time PCR in another non-twin cohort (MMD n = 3; red dots, control n = 3; blue dots, please refer to Table 1). There was a trend of difference in the respective hsa-miR-328-3p and − 6722-3p expression levels in iPSECs between MMD and control groups (hsa-miR-328-3p, 6.5 ± 3.0 and 1.1 ± 0.3, p = 0.15; hsa-miR-6722-3p, 3.8 ± 1.4 and 1.2 ± 0.5, p = 0.15). Conversely, no trend of difference was observed in hsa-miR-150-5p between MMD and control groups (2.1 ± 1.0 and 1.1 ± 0.3, p = 0.40, respectively). Data represents as mean ± SEM. Each individual data was plotted by same color and same shape code
