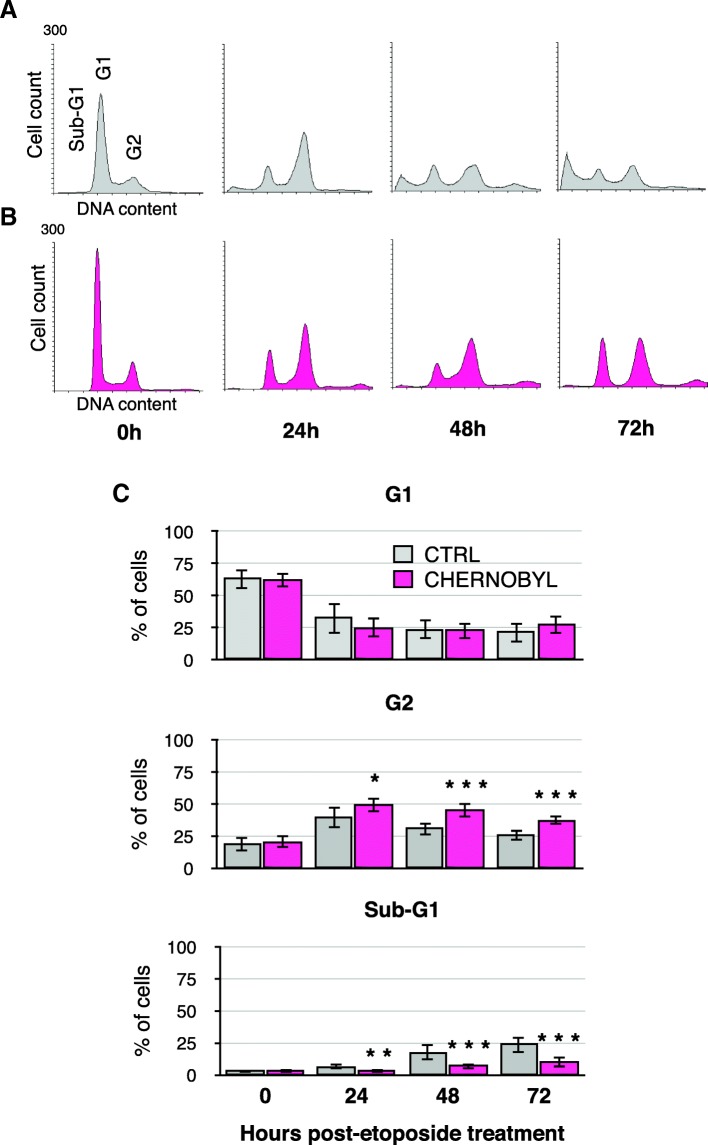
Fig. 4.
After DNA damage Chernobyl fibroblasts arrest stably at G2 phase. Example propidium iodide flow cytometry profile for one a.) control and b. Chernobyl cell line after 24, 48, and 72 h from etaposide treatment. c. The bar charts show the percentage of cells in G1, G2, and sub-G1 cell cycle phase for Chernobyl and control fibroblasts according to their DNA content by flow cytometry after 24, 48, and 72 h from etoposide treatment. The location of cells in sub-G1 (dying cells), G1, and G2 cell cycle phase are marked in the DNA histogram. The bar chart results are from three separate experiments using eight Chernobyl (N = 24) and eight control (N = 24) cell lines, variation is shown by standard deviation, and statistical analysis was done with Student’s t-test (* = p ≤ 0.05, ** = p ≤ 0.01, *** = p ≤ 0.001)

