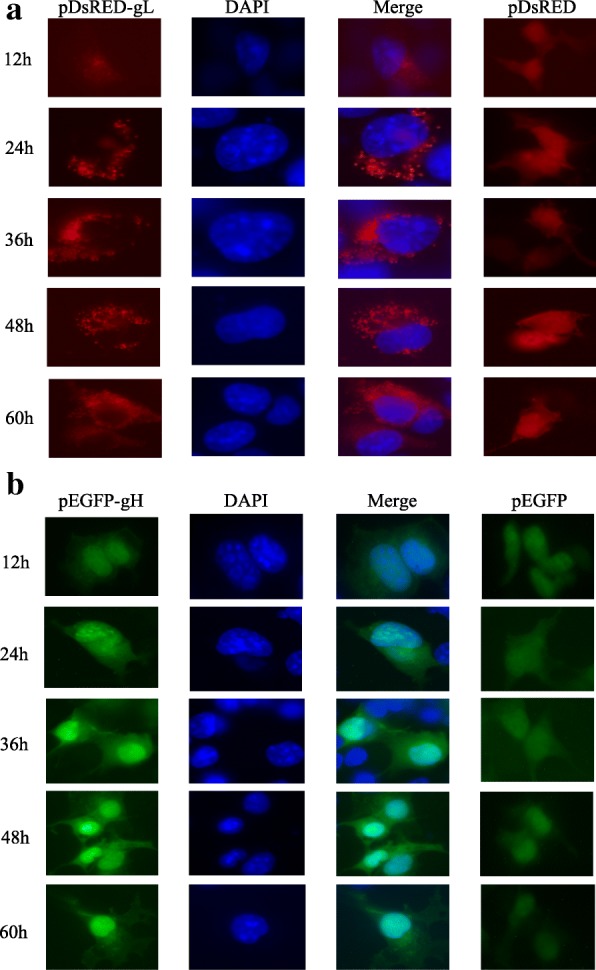
Fig. 2.

Intracellular localization and expression phase of DEV gH and gL respectively in COS-7 cells. a In the first column, red shows the expression and intracellular localization of pDsRED-N-gL. In the second column, blue shows the nuclear stained with DAPI. The third column represents the merged images. The vector pDsRED-N as a negative control was showed in the fourth column. b Similarly, green shows the expression and intracellular localization of pEGFP-N-gH; blue shows the nuclear stained with DAPI. The vector pEGFP-N as a negative control was showed in the fourth column
