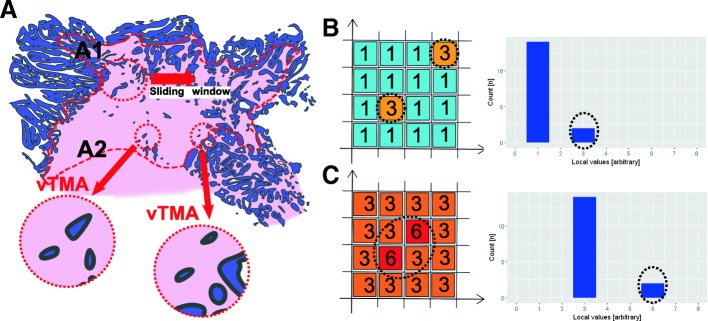
Fig. 3.
Sketch of the analysis. A) ROI tumor (not shown) and the ROI border (dashed red line) were manually delineated by a pathologist (CW). A1: a sliding window moved over the ROI border and cropped every half TMA diameter in the underlying, TMA core-sized image. A2: The resulting tile (exactly the size of one TMA core) was then defined as a virtual TMA (vTMA). b, c This procedure leads to a value (number of tumor buds or budding score) per vTMA. This spatial data could be plotted as a heat map (example heat maps with arbitrary values in the left part) or as a histogram (right part of the figure)

