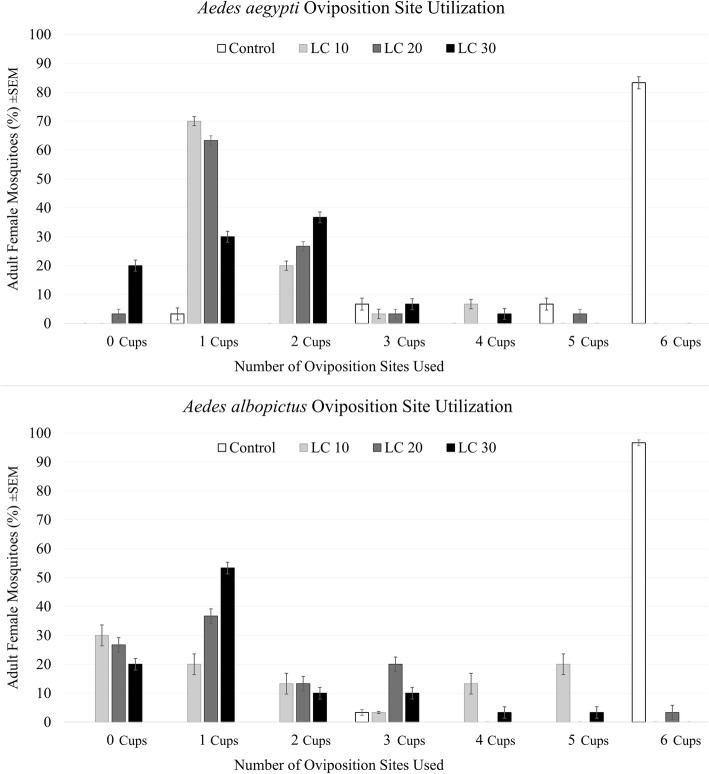
Fig. 2.
Cluster graphs representing the mean percentage of adult Aedes aegypti (L.) (n = 30) and Ae. albopictus (Skuse) (n = 30) ovipositing in 0, 1, 2, 3, 4, 5 or 6 cups following exposure to three sublethal concentrations of transfluthrin (LC10, LC20, LC30). Figures shown with a standard error of the mean as I-bars

