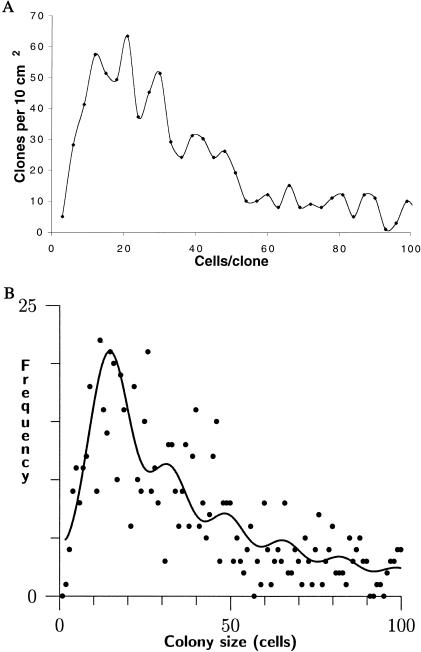
Figure 4.
Quantized distribution of sizes of p53-mutant clones. (A) In a qualitative analysis of 868 clones grouped into size bins three cells in width, maxima occurred in the clone size distribution at intervals of ≈12–16 cells/clone. Clones larger than 100 cells are not shown. (B) Statistical analysis of clone size frequencies as the product of the aperiodic Γ distribution and a periodic series of evenly spaced normal distributions (see Methods) leads to an estimated spacing parameter μ of 16 ± 6 cells (P < 10−16). Because an epidermal stem cell compartment in murine dorsal skin contains ≈12–14 nucleated keratinocytes, these peaks correspond to individual mutant stem cell compartments. The height of successive peaks decreased in ratios of 0.5–0.8, implying that a clone of size n compartments has an ≈2/3 probability of expanding to size n + 1 under these irradiation conditions. All clones were included in the analysis; not shown because of space are clones >100 cells and three points corresponding to high-frequency small clones.

