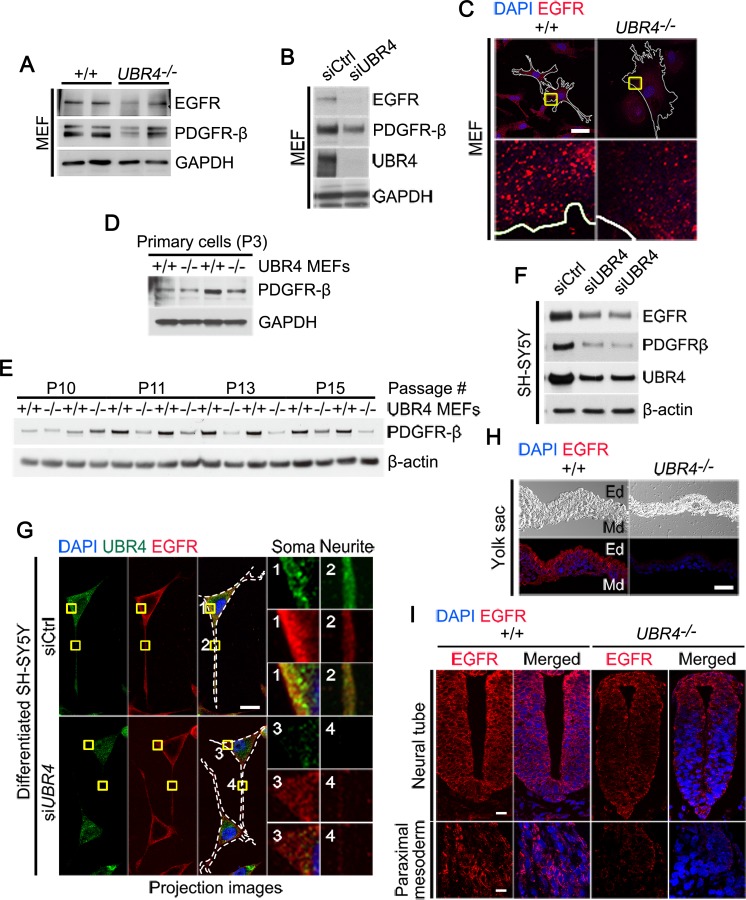
Fig 5. UBR4-loss induces the depletion of EGFR and PDGFR from the plasma membrane.
(A) Immunoblotting analysis of EGFR and PDGFR-β in +/+ and UBR4-/- MEFs. (B) Immunoblotting analysis of EGFR and PDGFR-β in siControl (siCtrl) and siUBR4-treated MEFs. (C) Immunostaining analysis of EGFR using +/+ and UBR4-/- MEFs. Solid white lines delineate the cell boundary (scale bar = 40 μm). Enlarged views show the areas indicated by yellow rectangles (scale bar = 3 μm). (D) Immunoblotting analysis of PDGFR-β using primary cultures of +/+ and UBR4-/- MEFs at passages 3. GAPDH was probed for loading control. (E) Immunoblotting analysis of PDGFR-β in +/+ and UBR4-/- MEFs at passages 10, 11, 13, and 15. β-Actin was probed for loading control. (F) Immunoblotting analysis of EGFR, PDGFR-β, and UBR4 in siControl (siCtrl) and siUBR4-treated SH-SY5Y cells. (G) Immunostaining of EGFR and UBR4 in siControl (siCtrl) and siUBR4-treated differentiated SH-SY5Y. Retinoic acid-derived differentiated SH-SY5Y cells were transiently transfected with siRNA for 48 h. Total 12 images were collected using the confocal microscope at 0.36 μm intervals to create a stack in the Z axis. The fluorescence intensity of EGFR was significantly down-regulated in UBR4 knockdown SH-SY5Y cells. White dotted lines delineate the cell boundary (scale bar = 20 μm). Enlarged views show the areas indicated by yellow rectangles and numbers. (H) Immunostaining analysis of EGFR on the cross sections of +/+ and UBR4-/- YSs at E9.5. EGFR was significantly down-regulated in the YS of UBR4-/- embryos at E9.5 (scale bar = 10 μm). Ed, endodermal layer; Md, mesodermal layer. (I) Immunostaining analysis of EGFR on the cross-sections of +/+ and UBR4-/- embryos at E9.5. EGFR was markedly down-regulated in various embryonic tissues, such as the neural tube, and paraximal mesoderm (scale bar = 5 μm).

