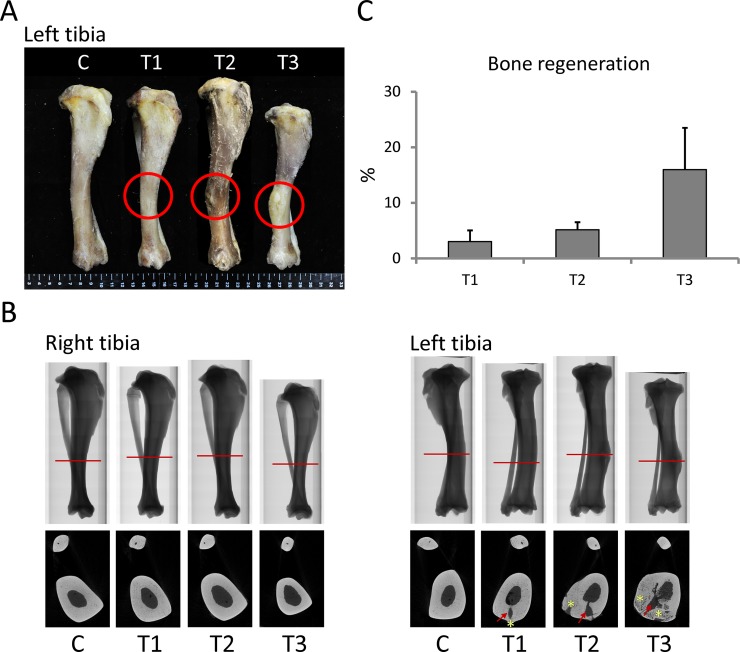
Fig 6. Bone regeneration was evidenced at the transplanted site.
(A) Image of tibiae after cell transplantation (red circles indicated transplanted sites). (B) Micro-CT images illustrating transplanted sites retrieved from sections indicated by red lines (red arrows indicated a hole exposed by bone drill; yellow stars indicated regenerated bone). (C) The rate of bone regeneration in each treatment group. C, control; T1, treatment 1; T2, treatment 2; T3, treatment 3. N = 3 in each group.

