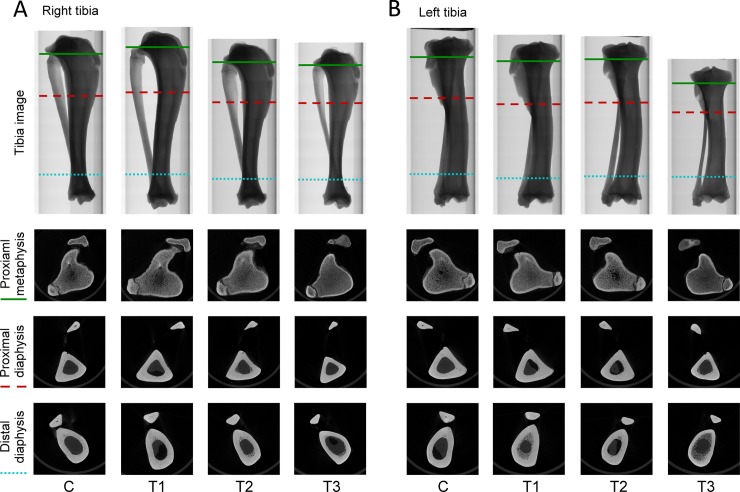
Fig 9. Improvement of cortical bone structures in the T3 group.
(A) Representative micro-CT image of tibiae after cell transplantation. (B) Representative micro-CT image of proximal metaphysis, proximal diaphysis, and distal diaphysis retrieved from green solid line, red dashed line, and blue dotted line, respectively. C, control; T1, treatment 1; T2, treatment 2; T3, treatment 3. N = 3 in each group.

