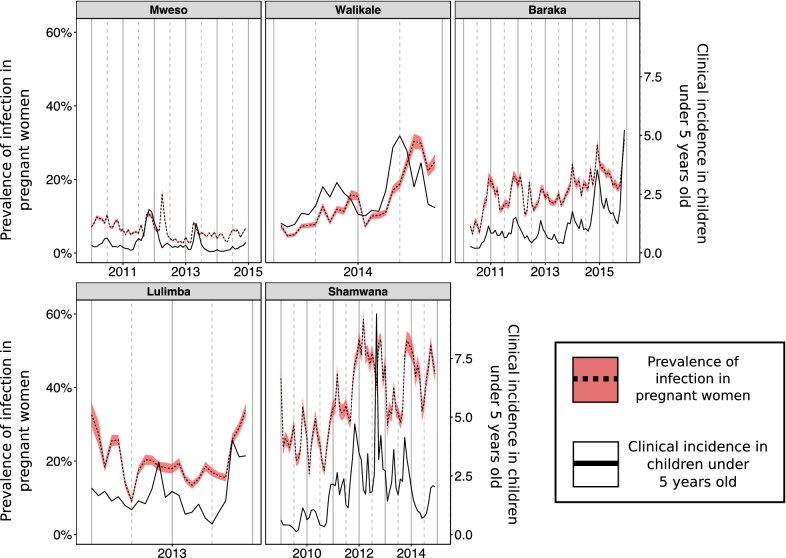
Fig. 3.
Time series data from the five different settings used in the analyses. The solid black line shows the recorded clinical incidence rate in children under 5 years old each month (cases per child per year). The dotted black line shows the recorded anti-natal clinic prevalence recorded each month with the red shaded area indicating the 95% confidence intervals using the normal approximation method. Data are available for different durations in the different settings

