Fig. 5.
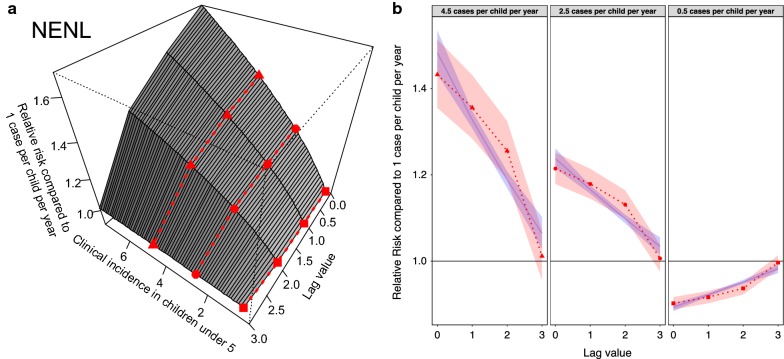
The best fit “NENL” model showing how clinical incidence over the last 3 months influences current anti-natal clinic (ANC) prevalence in terms of relative risk when compared to an observation of 1 case per child per year. a Gives the full 3D relationship (the crossbasis function). Values greater than 1 indicate an increase in ANC prevalence whilst values less than one signify a decline. b Cross-sectional slices through the crossbasis function at three different clinical incidence values denoted by the shape of the points and corresponding lines on a. The red shaded band shows the 95% confidence interval in the fitted lagged effects whilst the blue line and associated band show the lagged effects predicted by the model NELL (allowing a comparison between the linear and non-linear lagged effects)

