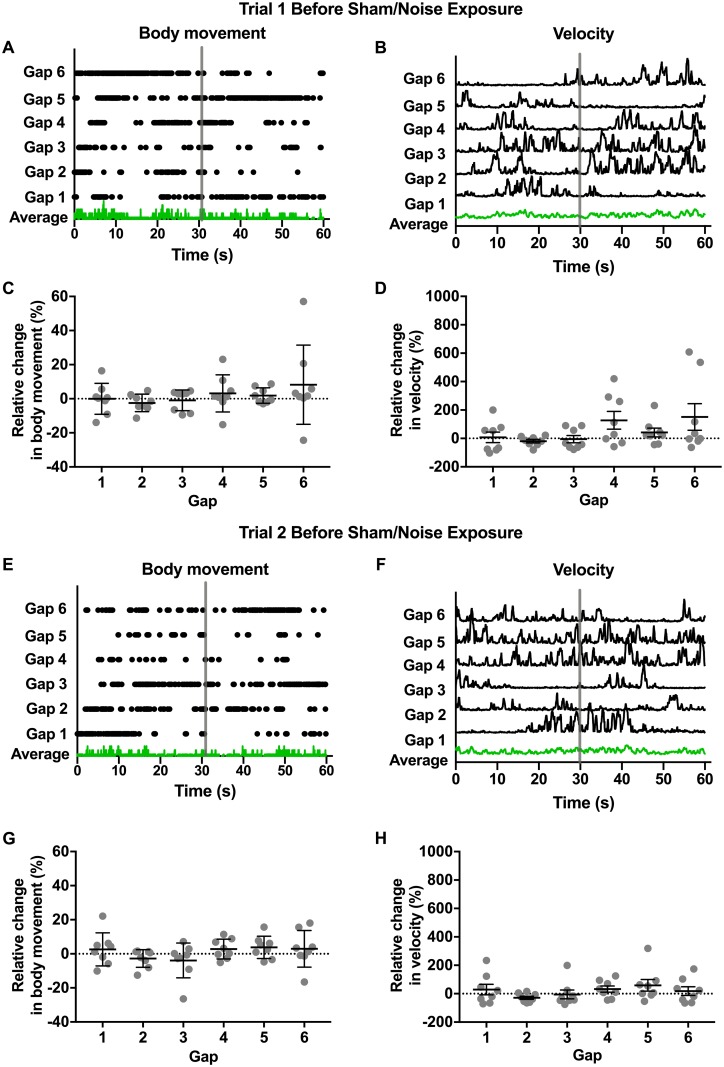
Fig 3. Changes in movement in response to silent gaps before sham/noise exposure.
Changes in movement in response to silent gaps were measured in two trials before sham/noise exposure (trial 1 and 2). Each trial was 8.5 min in duration and contained 6 silent gaps of either 500 ms or 1 s in a background of white noise (80 dB SPL). Movement was quantified in two ways: 1) “body movement” or movement of the head, tail, and/or torso (center point) and 2) “velocity” or velocity measured at the torso (center point). A, B, E, and F. Body movement (A and E) and velocity (B and F) are plotted for an individual mouse for trial 1 (A and B) and trial 2 (E and F). To compare body movement and velocity across gaps from an individual trial, data are aligned across gaps (indicated by vertical gray bars) to show movement metrics for the 30 s preceding the onset of the silent gap, the 5 s containing the gap, and the subsequent 30 s. Because mice were generally very active, body movement plots (A and E) indicate periods of no movement during these time windows. Green traces indicate the average responses across the aligned time windows for the example mouse (A, B, E, and F). Across gaps, no consistent change in body movement or velocity are apparent. C, D, G, and H. To compare changes in movement during the gaps across mice for the first (C and D) and second (G and H) trials, relative changes in movement during the 5 s containing the gap and the preceding 30 s were calculated (as described in the Methods) for both body movement (C and G) and velocity (D and H). For both metrics, relative changes in movement were not observed in response to silent gaps (Table 2). Gray dots indicate individual values and black bars indicate mean and SEM. In all cases, no significant differences were observed across mice for individual gaps (Kruskal Wallis test with Dunn’s multiple comparisons). Values and original data are provided in Table 2 and S2 Table.

