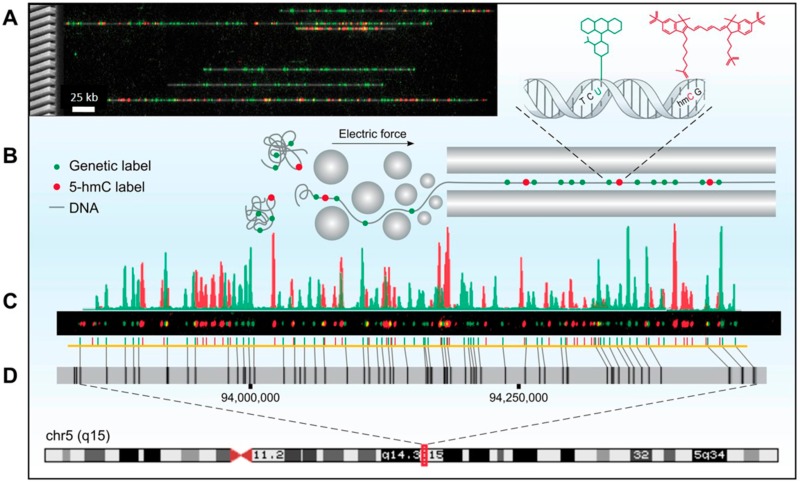
Figure 1.
Optical 5-hmC mapping experimental scheme. (A) Left: Scanning electron microscope (SEM) image of a silicon nanochannel array. Right: Stretched DNA molecules (gray) fluorescently labeled in two colors. Green: Sequence specific genetic barcode. Red: 5-hmC labels. (B) Fluorescently labeled molecules are extended in nanochannel arrays by electrophoresis. (C) Fluorescence intensity of genetic labels (green) and 5-hmC labels (red) along a single molecule. (D) Genetic labels (green) are used to align a digital representation of the molecule in part C (yellow) to an in silico generated reference (gray) of chromosome 5, highlighting large structural variations such as the 7 kbp deletion in the midright part of the molecule, denoted by the diagonal alignment marks. 5-hmC labels (red) are mapped on the basis of genetic alignment.

