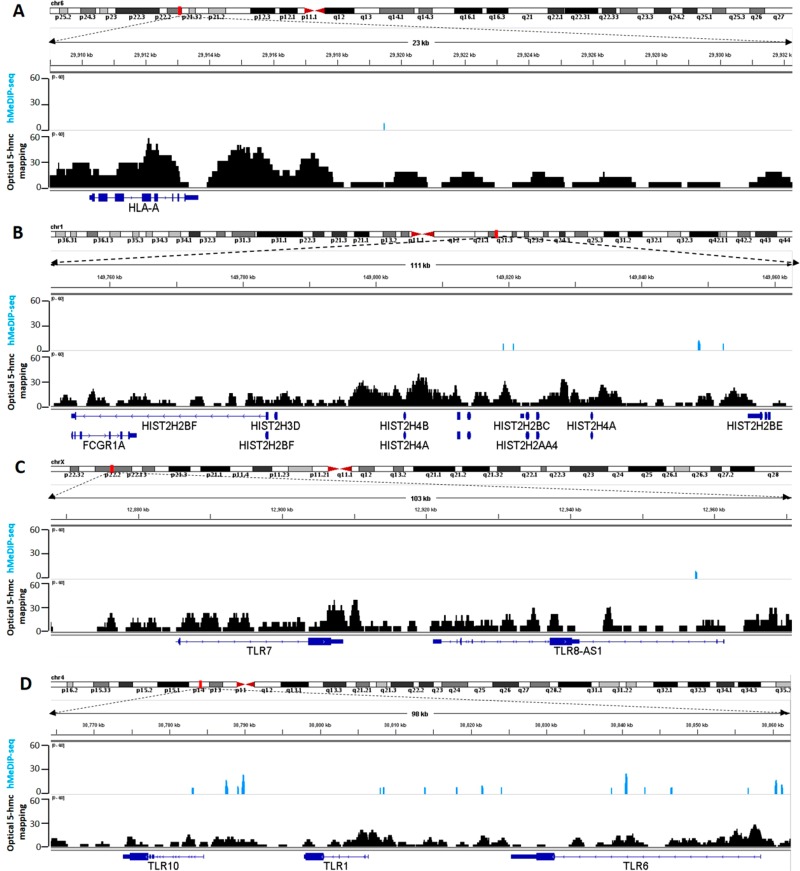
Figure 5.
Epigenetic characterization of variable regions by optical 5-hmC mapping “long reads”. Light blue: hMeDIP-seq. Black: optical 5-hmC mapping. Blue: gene symbol. (A) 5-hmC coverage of 23 kbp around the HLA-A gene. (B) 5-hmC coverage of 111 kbp containing the histone gene cluster. (C) 5-hmC coverage of 103 kbp around TLR7 and TLR8-AS1. (D) 5-hmC coverage of 98 kbp containing the TLR cluster located on chromosome 4.

