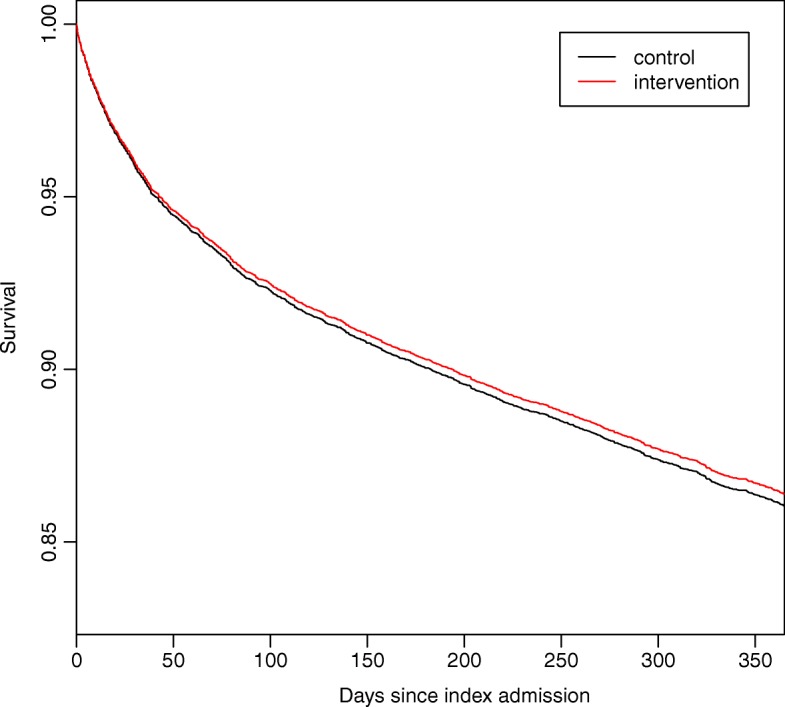
Fig. 2.

Kaplan-Meier plot displaying survival until end of follow-up. The Kaplan-Meier plot shows survival of patients acutely admitted to two emergency departments stratified by intervention period (measurement of soluble urokinase plasminogen activator receptor, suPAR) and control period (no suPAR measurement). Log-rank test: P = 0.61
