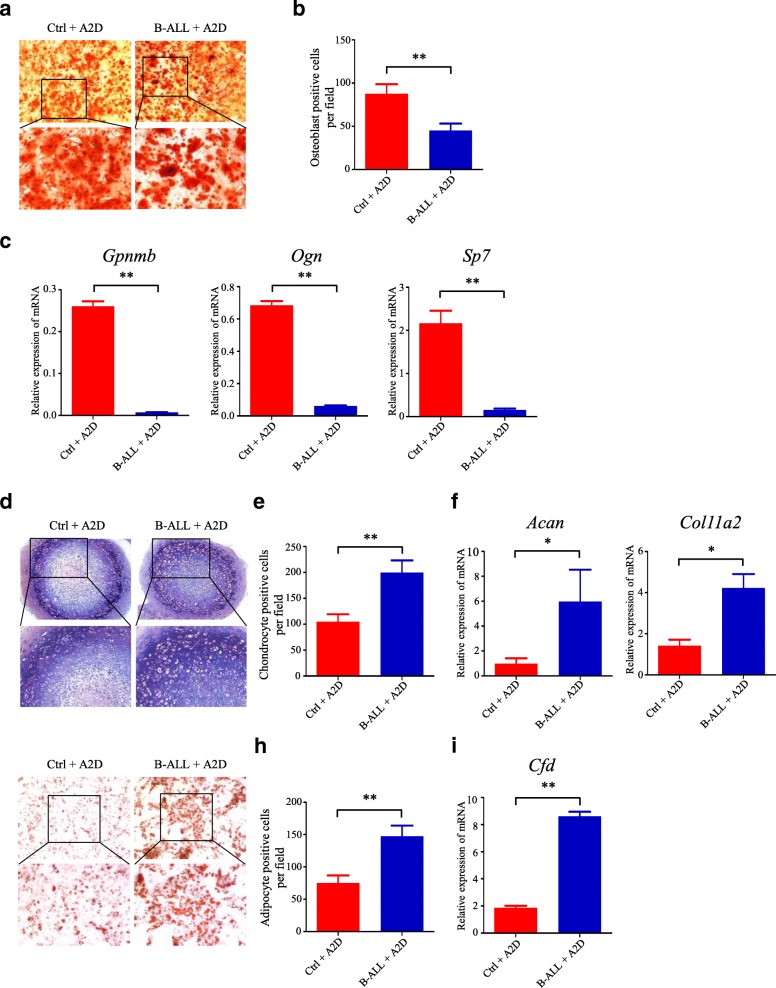
Fig. 2.
Chemotherapy-induced MSCs are prone to differentiate into adipocytes and chondrocytes. a Osteogenic differentiation of MSCs derived from Ctrl+A2D and B-ALL+A2D by Alizarin Red S staining. b Statistical summary of osteoblast number per field in (a). c The osteoblastic differentiation markers (Gpnmb, Ogn and Sp7) were evaluated by qRT-PCR. d Chondrogenic differentiation of MSCs derived from Ctrl+A2D and B-ALL+A2D by Toluidine Blue staining. e Statistical summary of chondrogenic cell number per field in (d). f The chondrogenic differentiation markers (Acan and Col11a2) were evaluated by qRT-PCR. g Adipogenic differentiation of MSCs derived from Ctrl+A2D and B-ALL+A2D by Oil Red staining. h Statistical summary of adipogenic cell number per field in (g). i The chondrogenic differentiation markers (Cfd) were evaluated by qRT-PCR. All data in this figure were shown as mean ± SD from three separate experiments. * P ≤ 0.05; ** P < 0.01

