Fig. 5.
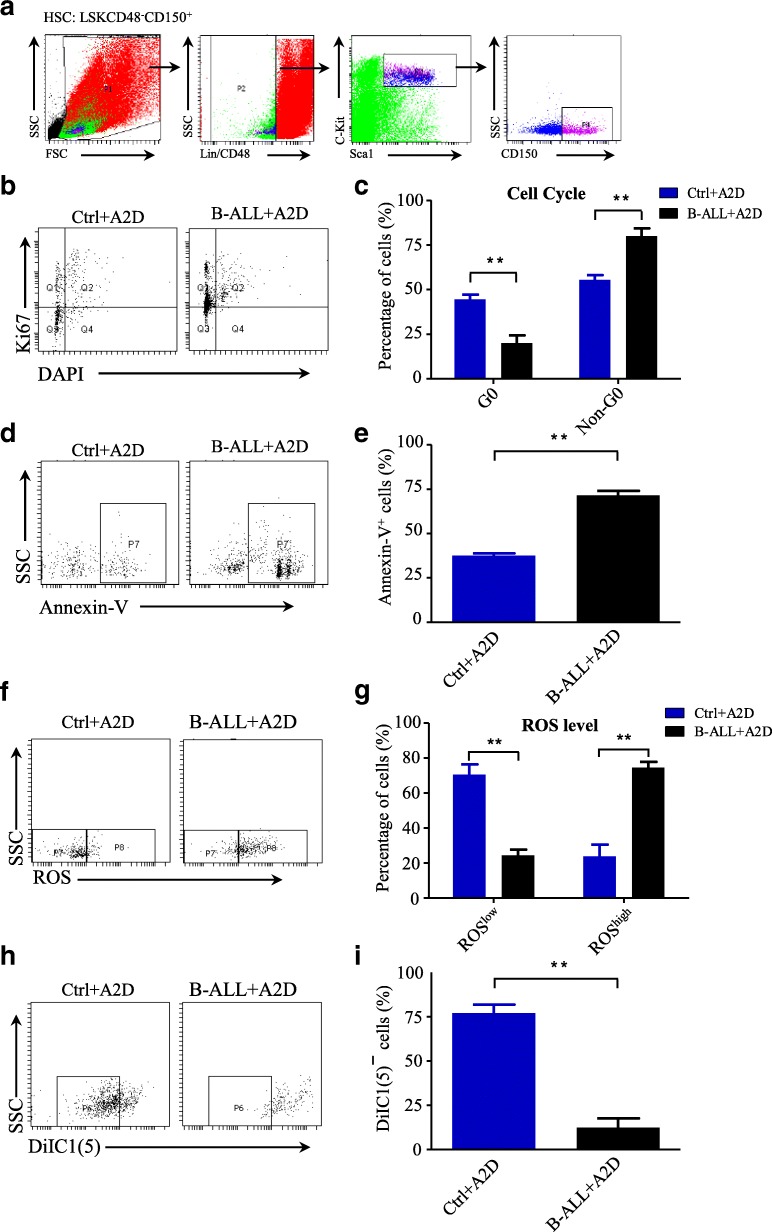
Chemotherapy-induced niche increases the ROS levels of HSCs and induces cell apoptosis. a Flow cytometry analysis strategy of HSC. Lineage−sca-1+c-kit+CD48−CD150+ represent HSCs population. b Cell cycle analysis of HSCs in Ctrl+A2D and B-ALL+A2D using Ki-67 and DAPI staining. Representative plots (Lineage−sca-1+c-kit+CD48−CD150+ gated). c Statistical summary of cell cycle distribution in (b). n = 3–6 mice per group. d The cell apoptosis of HSCs in Ctrl+A2D and B-ALL+A2D was analyzed by flow cytometry. e Statistical summary of cell apoptosis ratio of HSCs in (d). n = 3–6 mice per group. f The intracellular ROS level of HSCs in Ctrl+A2D and B-ALL+A2D was detected by H2-DCFDA staining. g Statistical summary of ROS level distribution in (f). n = 3–6 mice per group. h The mitochondrial membrane potential of HSCs in Ctrl+A2D and B-ALL+A2D was detected by DiIC1(5) staining. i Statistical summary of mitochondrial membrane potential distribution in (h). n = 3–6 mice per group. All data in this figure were shown as mean ± SD from three separate experiments. * P ≤ 0.05; ** P < 0.01

