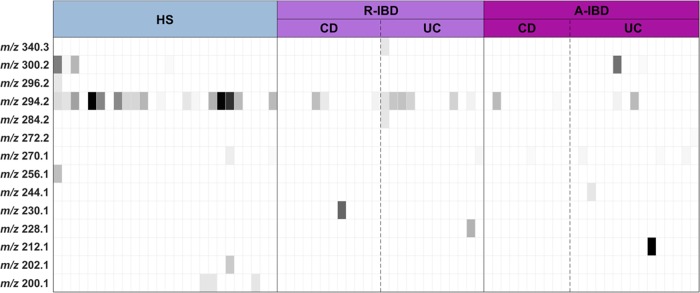
Fig 1. Heatmap of the results of the AHL profile in IBD patients and healthy controls.
AHLs are designated by their m/z. The grey colour bar indicates AHL m/z concentrations from none (white) to highest concentration (black). HS: healthy subject, R-IBD: inflammatory bowel disease patients in remission, A-IBD: inflammatory bowel disease patients in flare, UC: ulcerative colitis, CD: Crohn’s disease.

