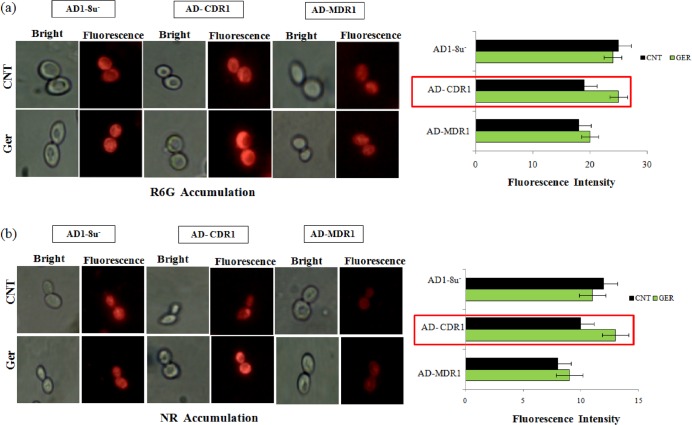
Fig 2. R6G and NR intracellular accumulation.
(a) Left panel showing the fluorescence images of R6G stained AD1-8u-, AD-CDR1, AD-MDR1 strains in presence of Ger (135μg/ml). Right panel shows the bar graph of the fluorescence intensity measured by Image J software. (b) Left panel showing the fluorescence images of NR stained AD1-8u-, AD-CDR1, AD-MDR1 strains in presence of Ger (135μg/ml). Right panel shows the bar graph of the fluorescence intensity measured by Image J software.

