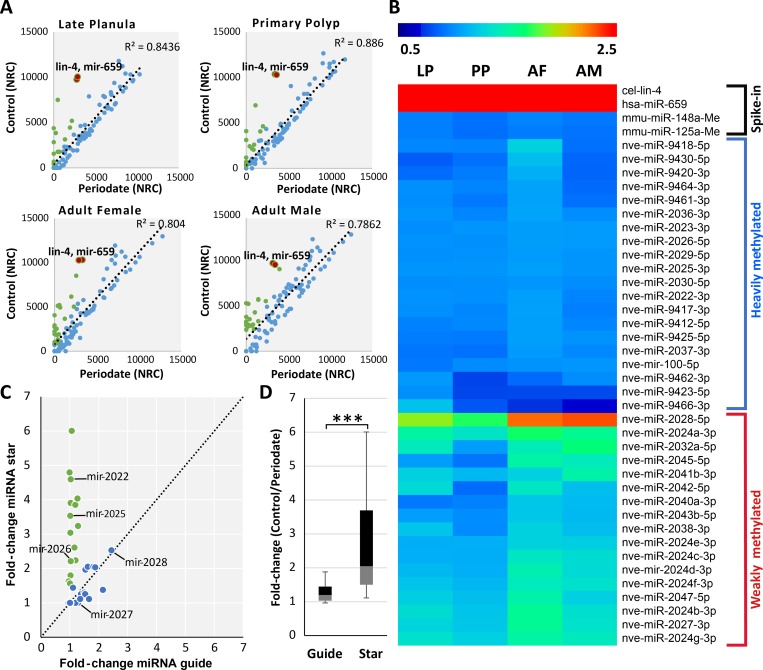
Fig 2. In Nematostella vectensis the miRNAs are frequently methylated and methylation frequencies are stable during development.
(A) Scatter plot presenting the change in normalized read counts of individual miRNAs in control and periodate treated libraries. In blue, miRNAs whose levels changed less than two-fold. In green, miRNAs whose levels dropped two-fold or more. The majority of the miRNAs showed little to no change after periodate treatment. The non-methylated spike-ins are indicated as red dots in the scatterplot to demonstrate the efficiency of the periodate treatment. The axes are scaled to normalized read counts (NRC). The data represents the mean of three independent biological replicates. (B) Heatmap displaying log2-fold change of miRNA read counts between periodate treated and untreated samples in late planula (LP), primary polyp [9], adult female and male (AF and AM). The data is divided into two major clusters of heavily and weakly methylated miRNAs based on the fold change. To reduce noise, lowly expressed miRNAs (less than 50 read counts for a individual miRNA) were excluded from this analysis. (C) Depletion of miRNA* upon periodate treatment. The scatterplot represents the fold change in read counts of guide and star sequences of individual miRNAs before and after periodate treatment. Ratio of fold changes equal or larger than 1.5 are indicated in green. The miRNA* of miR-2022, miR-2025 and miR-2026 showed significantly higher fold-change compared to their guide sequences. Guides of moderately and weakly methylated miRNAs such as miR-2027 and miR-2028 showed a similar fold change to their stars. The results are presented in a box-plot in (D) showing the overall higher fold-change for star sequences compared to their guides. The box plot presenting the mean fold change for miRNA and miRNA* analyzed from planula larvae, primary polyps, adult male and female. P < 0.00001, Mann-Whitney test, miRNA n = 31.

