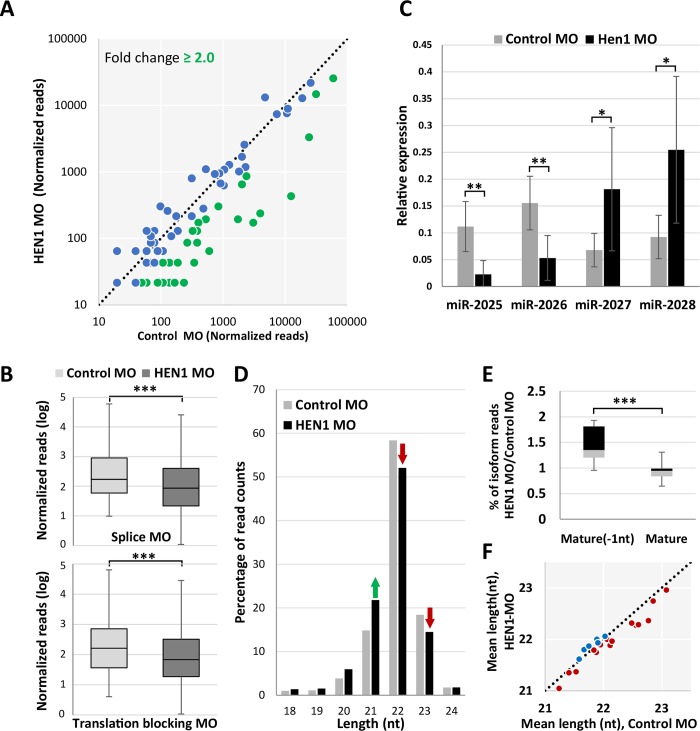
Fig 4. HEN1 is required for miRNA stability.
(A) Change in miRNA read counts after HEN1 depletion is depicted by scatter plot. Each dot represents the read counts of an individual miRNA before and after HEN1 knockdown. miRNAs that showed a depletion ≥ two-fold change are indicated in green. The data represent the mean of two independent biological replicates. (B) The relative abundance of miRNA read counts of HEN1 MO vs. control MO are presented in a bar plot. A significant reduction of miRNA read counts is noted in HEN1 MO, (P < .0001, Wilcoxon signed-rank test). The data represents the mean of two independent biological replicates ± SD. (C) The levels of miR-2025, miR-2026, miR-2027 and miR-2028, before and after HEN1 knockdown measured by qPCR using LNA primers. As opposed to miR-2027 and miR-2028, the abundance of mir-2025 and mir-2026 decreased in HEN1 knockdown. The data represents the mean of minimum five independent biological replicates ± SD. ** P ≤ 0.005. * P ≤ 0.05, (Student’s t-test). (D) Loss of HEN1 results in shortened Nematostella miRNAs. Total reads mapped to guide miRNAs are analysed based on their isoform sizes ranging from 18 to 24 nt. the read counts were presented as the percentage of nucleotide length distribution. In HEN1 MO data the miRNA length is reduced at the percentage of 22 and 23 nt sized isoforms, as indicated with red arrows. (E) miRNAs from HEN1 MO showed accumulation of shorter isoforms. The ratio of percentage of read counts of the most abundant mature miRNA isoform and an isoform shorter by one nucleotide than dominant mature miRNA (“Mature -1nt”) was calculated between the HEN1 MO and control MO the experiment was performed in duplicates and the result is significant at P ≤ 0.01 (Mann-Whitney test). (F) Mean lengths of individual miRNAs were compared between the control MO and HEN1 MO, the data are presented by scatter plot. miRNAs showed in red dots exhibited decrease in mean length in HEN1 MO vs. control MO (P ≤ 0.003, Wilcoxon Signed-Rank Test).

