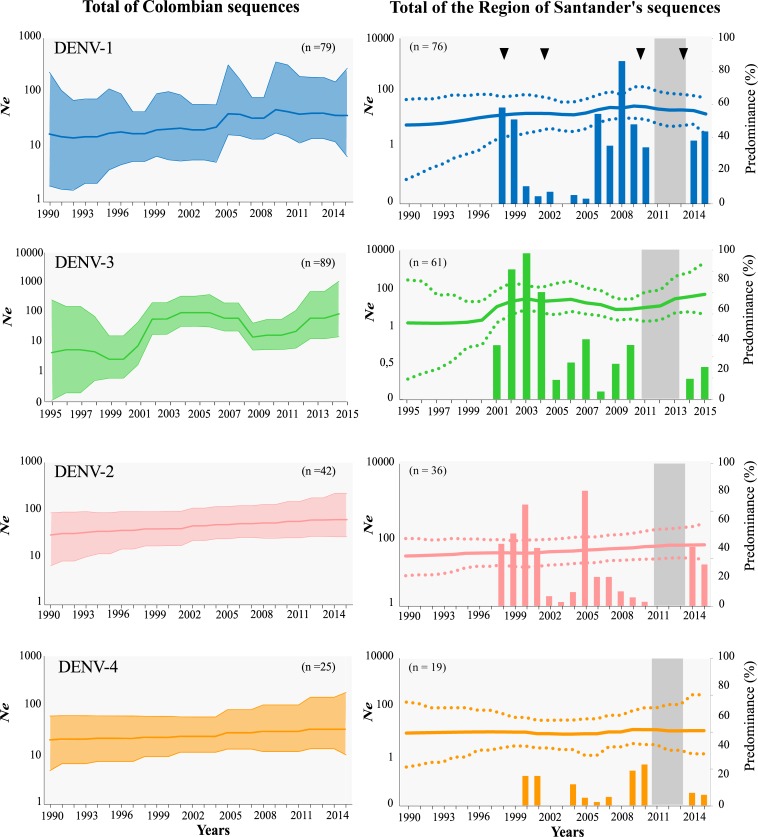
Fig 7. DENV Population dynamics in Colombia and the state of Santander (1998–2015).
Left panels: relative genetic diversity of each serotype in Colombia estimated using non-parametric Skygrid coalescent analysis. Right panels: relative genetic diversity of each serotype in the state of Santander overlapped with the respective serotype predominance. National dengue epidemics indicated with triangles. Gray colored areas show the periods that were not sampled. Ne denotes effective population size in logarithmic scale.

