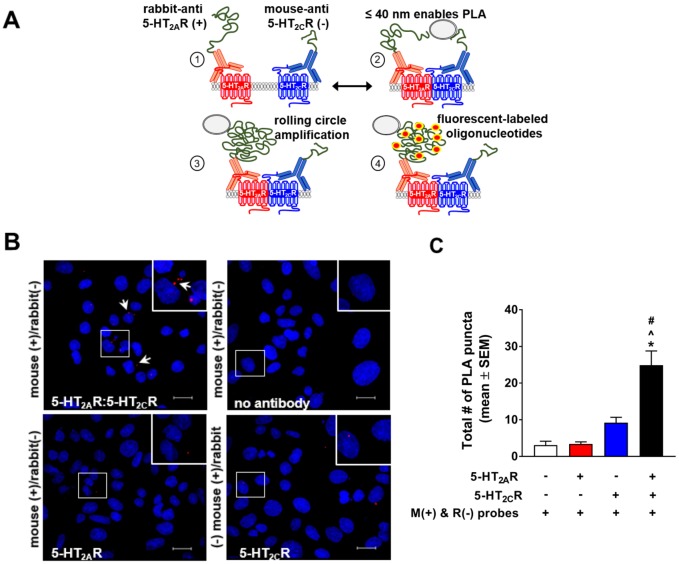
Fig 3. Proximity ligation assay indicates 5-HT2AR:5-HT2CR interaction within 50 nm.
(A) Schematic of proximity ligation assay (PLA) between 5-HT2CR and 5-HT2AR. (B) Representative 60X confocal photomicrographs of PLA signal from 5-HT2CR and 5-HT2AR heteromeric formation (red puncta) and associated negative controls. PLA was performed using 5-HT2AR (rabbit polyclonal) and 5-HT2CR (mouse monoclonal) primary antibody and oligonucleotide-linked PLA secondary probes [mouse, M(+) and rabbit, R(-)]. Scale bars represent 10 μm. (C) Quantification of puncta from 20X photomicrographs from five independent experiments. *p < 0.05 vs. M(+) and R(-) probes only; ^p < 0.05 vs. 5-HT2AR plus M(+) and R(-) probes; #p < 0.05 vs. 5-HT2CR plus M(+) and R(-) probes.

