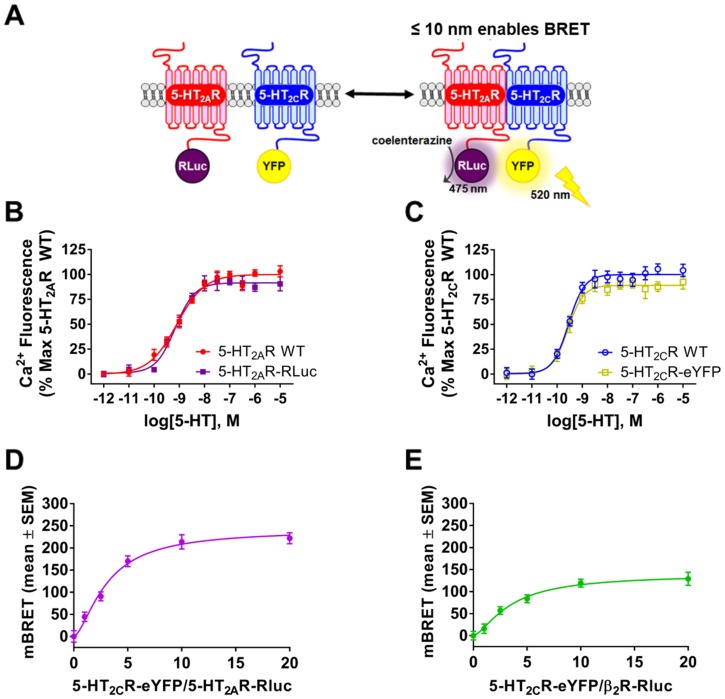
Fig 4. BRET indicates 5-HT2AR:5-HT2CR interaction within 10 nm.
(A) Schematic of BRET assay between 5-HT2CR-RLuc and 5-HT2AR-eYFP constructs. (B) Representative concentration response curve for 5-HT-mediated intracellular calcium (Cai2+) release for WT 5-HT2AR (red) and 5-HT2AR-RLuc (purple) constructs transiently transfected in HEK293 cells. The 5-HT-mediated increase in Cai2+ dye fluorescence over baseline was calculated as the % maximal response of WT 5-HT2AR. (C) Representative concentration response curve for 5-HT-mediated Cai2+ release for WT 5-HT2CR (blue) and 5-HT2CR-eYFP (yellow) constructs transiently transfected in HEK293 cells. The 5-HT-mediated increase in Cai2+ dye fluorescence over baseline was calculated as the % maximal response of WT 5-HT2AR. (D) Representative BRET curve from HEK293 cells co-transfected with constant amount 5-HT2AR-RLuc (100 ng; donor construct) and increasing amounts of the 5-HT2CR-eYFP (1–20 fold excess; acceptor construct). (E) Representative BRET curve from HEK293 cells co-transfected with constant amount β2-AR-Rluc (100 ng; donor construct) and increasing amounts of the 5-HT2CR-eYFP (1–20 fold excess; acceptor construct). The mBRET signal was determined by calculating the ratio of light emitted at 528 nm to 460 nm (X 1000). Results obtained from four independent experiments.

