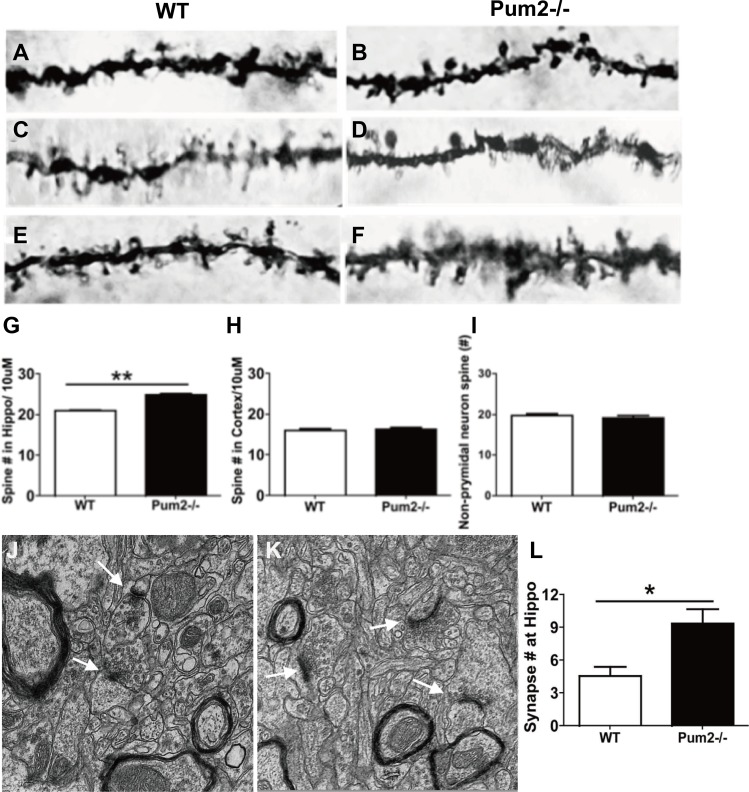
Figure 3. Spine density of Pum2–/– and WT mice by Golgi staining.
Spine density significantly increased in the pyramidal cells within the CA1 area of hippocampus (A, B, G) but not in layer V of the frontal cortex (C, D, H) and non-pyramidal cells within the CA1 area of hippocampus (E, F, I). (J) Electron microscopy (EM) quantification of synapses in the stratum radiatum of the CA1. The representative images demonstrated the ultrastructure of synapses in the stratum radiatum in WT mice (J) and Pum2–/– (K) (white arrows indicate synapses). Quantification of synapse number revealed significantly higher number in Pum2–/– than WT mice (L). *means p < 0.05. Data represent as mean ± SEM.

