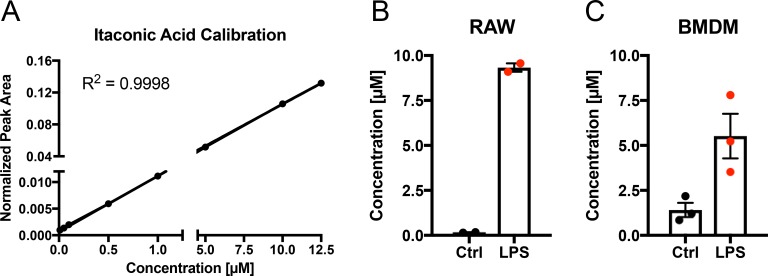
Figure 1. Quantification of itaconic acid concentration in cell culture medium upon LPS stimulation.
(A) External calibration curve (concentration range: 0.01–12.5 µM) for absolute quantification of IA in cell culture medium. (B–C) IA concentration (µM) in cell culture media of RAW264.7 (B) mouse macrophages and BMDMs (C) 6 h after stimulation (LPS) with 10 ng/ml LPS or of untreated cells (Ctrl). Each data point indicates one independent experiment with triplicate wells (2 experiments in (B) and three experiments in (C)). Data is represented as mean ± SEM.

