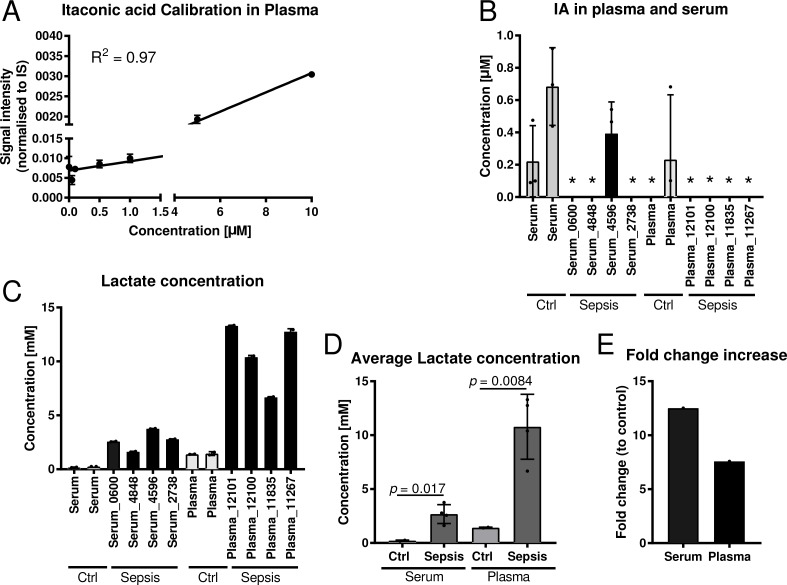
Figure 2. Quantification of itaconic acid and lactic acid in serum and plasma samples of sepsis patients.
(A) External calibration curve (concentration range: 0.01–10 µM) for absolute quantification of IA in plasma and serum. (B) Quantification of IA in four plasma and four serum samples of sepsis patients with respective healthy control samples. For background subtraction the determined average IA concentration of control samples was subtracted of the determined concentrations of the sepsis samples. Each sample was analysed in three technical replicates. *indicates samples with IA concentrations below the detection limit. (C–D) Quantification of lactate in the same samples as in (B) and (E) respective fold change increase of lactate in sepsis samples compared to respective controls. Data (A–D) is represented as mean ± SD.

