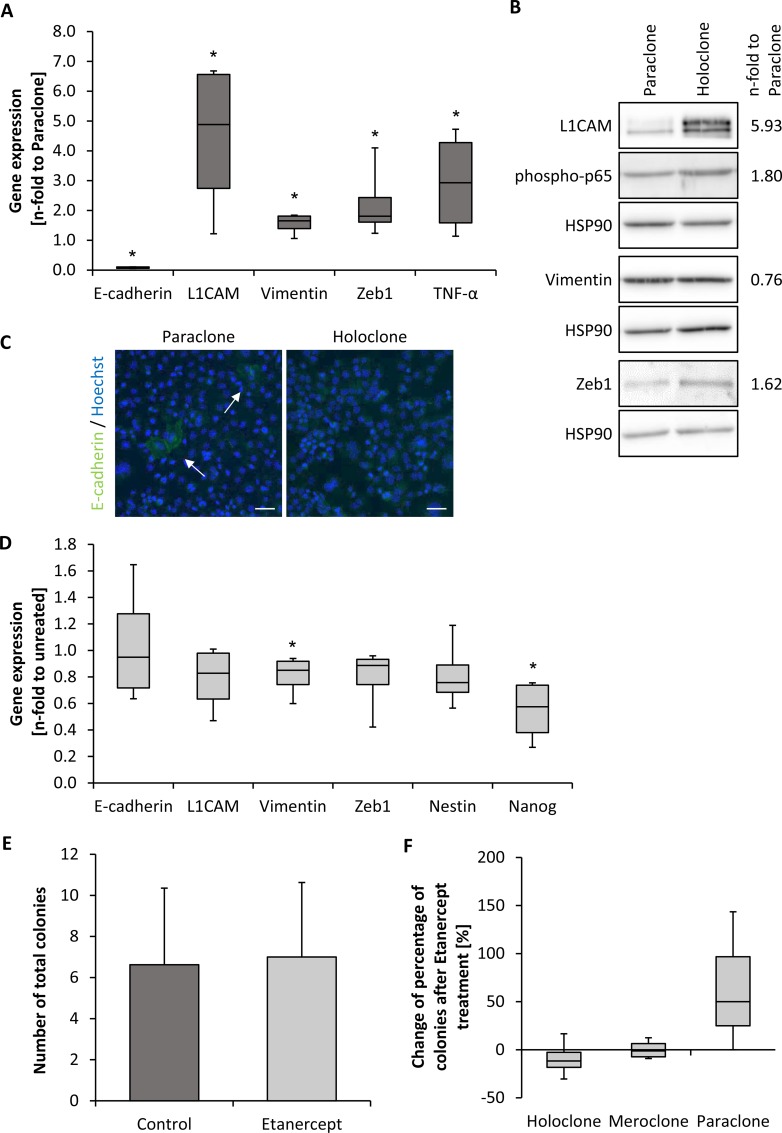
Figure 5. Panc1 holoclone cells exhibit a pronounced mesenchymal phenotype which is partly dependent on TNF-α signaling.
EMT-profile of Panc1 holo- and paraclone cells derived from expansion procedure. (A) RT-qPCR analysis for expression of E-cadherin, L1CAM, Vimentin, Zeb1 and TNF-α normalized to the housekeeping gene GAPDH and presented as n-fold expression compared to expression in paraclone cells. (B) Western blot analysis of L1CAM, Vimentin, phospho-p65 and Zeb1 in Panc1 para- and holoclone cells. HSP90 was used as loading control. One representative result of 4 independent experiments is shown. Numbers at the right side of the bands indicate average band intensities of holoclone probes determined by densitometric analysis. Values of the proteins of interest were divided by the values of the corresponding loading control (HSP90) and normalized to values of paraclones. (C) Immunofluorescence staining of E-cadherin (green) in Panc1 para- and holoclone cells. Hoechst staining (blue) was used for nuclei detection. Arrows indicate E-cadherin-expressing cells. Scale bar 50 μm. (D) RT-qPCR analysis for expression of E-cadherin, L1CAM, Vimentin, Zeb1 as well as Nestin and Nanog in Panc1 holoclone cells that were left untreated or treated with 10 μg/ml Etanercept for 72 hours. Specific gene expression was normalized to the housekeeping gene GAPDH and presented as n-fold expression compared to control. (E, F) For examining the influence of Etanercept on colony formation, 400 Panc1 holoclone cells were seeded in duplicates and treated with 10 μg/ml Etanercept on day 1 and 7 or left untreated as control. Colony formation was assessed after crystal violet staining on day 11. Only colonies containing more than 50 cells were counted and (E) the total number of colonies was determined as well as (F) the proportion of different colony types of total number of colonies. Data are shown as percentage change of Etanercept-treatment compared to control. Data are presented as mean and standard deviation or median and quartiles (Q1 as 25% and Q3 as 75%) of 4 independent experiments. * indicates statistically significant differences (p ≤ 0.05).

