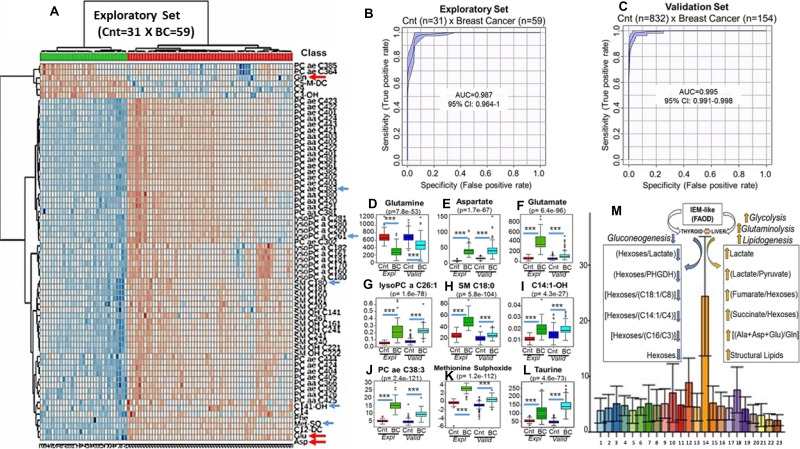
Figure 1.
Breast cancer discriminative performance of the top 50 individual metabolites quantified in blood (μmol/L), during exploratory set, using unsupervized clustering analysis with heatmap (A). Arrows are pointing to metabolites whose concentrations in blood (μmol/L) were analyzed by ANOVA during exploratory (Expl) (Red and Green Bars) and confirmed after validation (Valid) set (Dark and Light Blue Bars). The first red arrow at the top (a) show glutamine (Gln), the most abundant amino acid in healthy population (Cnt), whose concentrations, however, became very low in blood of breast cancer women (B, C) (D). On the other hand, the two red arrows at the bottom (A) are pointing to glutamate (Glu) and aspartate (Asp) whose concentrations are high in the blood of the same patients (E and F). This description completely fullfils the concept of “Glutaminolysis” where glutamine is consumed and transformed in glutamate and aspartate. The increased concentrations of sphyngomielins (SM C18:0) (G) and ether lipids (PC ae C38:3) (H) are suggestive that a systemic metabolic shift favoring biosynthesis is predominant in cancer patients. Accumulations, in blood, of acylcarnitines and lipids containing very-long chain fatty acids (C14:1-OH) (I) (lysoPC a C26:1) (J) are common metabolic features of mitochondrial and peroxisomal fatty acids oxidation deficiencies (FAOD) that are, usually followed, by disturbances in ReDOX homeostasis with elevations in oxidative stress and consequent damage to proteins as demonstrated by significant elevations in methionine sulphoxide residues (Met-SO) (K). Elevations in taurine (L), as will be demonstrated ahead, are directly related to increases in blood levels of oncometabolites succinate and fumarate. Figure 1A and 1B are showing the breast cancer discriminative performance during exploratory (A) and validation (B) sets using the equation {PC aa C36:6/[(Xle/Phe)/Tau]}/C102 and the lipid PC aa C28:1 whose absolute concentrations in blood were applied to multivariate ROC curve analysis. Increasing values generated by this metabolic signature were able to accurately segregate breast cancer from controls either during training [AUC = 0.987 (95% CI: 0.964-1), sensitivity = 96.72%, specificity = 96.78%, positive predictive value = 98.33% negative predictive value = 93.94%, average accuracy (100-fold cross validations) = 0.95 and predictive accuracy statistics (1000 permutations) = p < 2.04e-05] or validation sets [AUC = 0.995 (95% CI: 0.991-0.998), sensitivity = 98.09%, specificity = 96.18%, positive predictive value = 82.35%, negative predictive value = 99.64%, average accuracy (100-fold cross validations) = 0.96 and predictive accuracy statistics (1000 permutations) = p < 1.28e-06]. (M) depicts the positive (orange arrows) and negative (blue arrows) correlations among the increasing values of our ratio (Y-Axis) and the oncometabolites succinate, fumarate, lactate and hexoses as well as glutaminolysis (Ala+Asp+Glu/Gln) and structural lipids measured in different metabolic groups (X-Axis): (1)-grade zero metabolic syndrome; (2)-grade 1 metabolic syndrome; (3)-grade 2 metabolic syndrome; (4)-grade 3 metabolic syndrome; (5)-grade 4 metabolic syndrome; (6)-grade 5 metabolic syndrome; (7)-High Risk (RR 1.4) Breast Cancer; (8)-High Risk (RR 1.6) Breast Cancer; (9)-High Risk (RR 1.8) Breast Cancer; (10)-Polycistic Ovary Syndrome; (11)-Colon Cancer; (12)-Lung Cancer; (13)-Hepatocarcinoma; (14)-Breast Cancer; (15)-Hematological Malignancies (Baseline); (16)-Hematological Malignancies (Transplant); (17)-Hematological Malignancies (Engraftment); (18)-Head and Neck Cancer; (19)-Cirrhosis; (20)-Juvenile Arthritis; (21)-Autoimmune Hemolityc Anemia; (22)-Paroxysmal Nocturnal Haemoglobinuria and (23)-Human Immunodeficiency Virus. *** Indicates p < 0.001.

