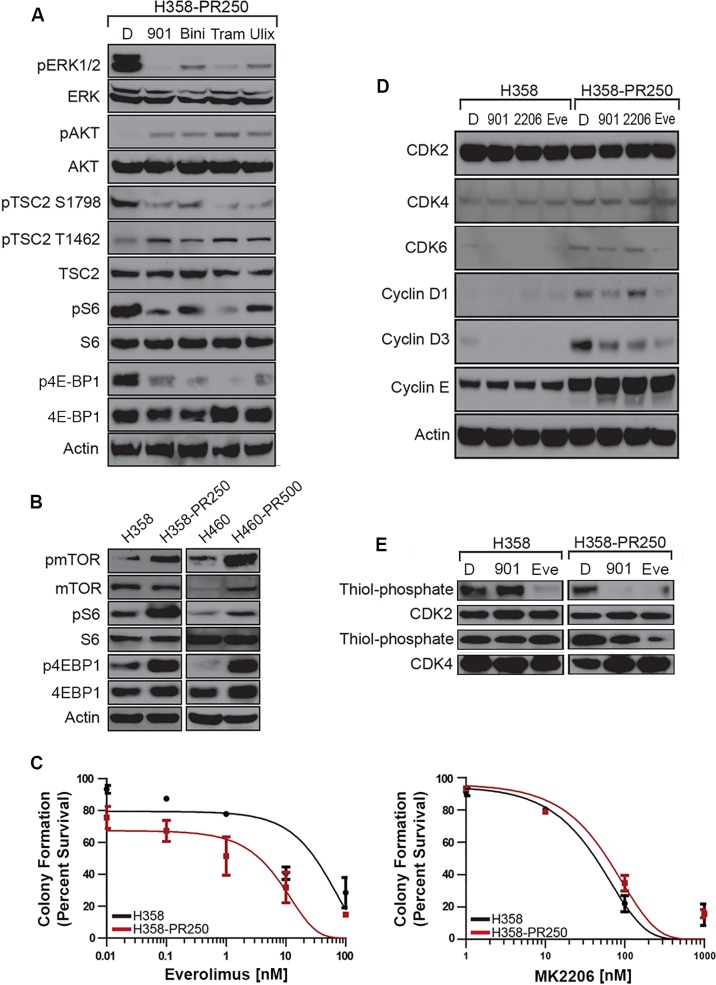
Figure 3. ERK1/2 promotes palbociclib resistance through the activation of the mTOR pathway.
A. Western blot analysis assessing the activation of signaling cascades in H358-PR250 cells treated with DMSO (D), 100 nM PD0325901 (901), 2000 nM binimetinib (Bini), 100 nM trametinib (Tram) or 1000 nM ulixertinib (Ulix) for 24 hours. B. Western blot analysis assessing the activity of mTOR, S6 ribosomal protein, 4E-BP1 and TSC2 in parental H358 and H358-PR250 cells (left panel) or H460 and H460-PR500 cells (right panel). C. Colony formation assay assessing the sensitivity of parental H358 and H358-PR250 cells to treatment for 14 days with the indicated doses of everolimus (left panel) and MK2206 (right panel). D. Assessment of CDK and G1 cyclin expression by Western blot analysis in parental H358 and H358-PR250 cells treated with DMSO (D), 100 nM PD0325901 (901), 2000 nM MK2206 (2206) or 100 nM everolimus (Eve) for 24 hours. E. Kinase activity assay examining the activity of CDK2 and CDK4 in parental H358 and H358-PR250 cells treated with DMSO (D), 100 nM PD0325901 (901) or 100 nM everolimus (Eve) for 24 hours.

