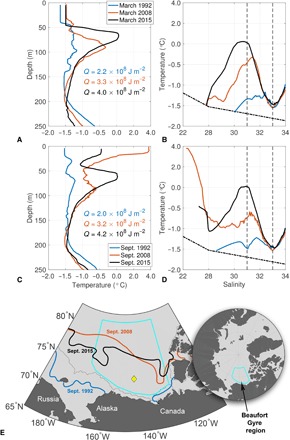
Fig. 1. Temperature and salinity in the BG.

(A) Temperature and depth profiles in March 1992, 2008, and 2015 and (B) the same profiles on the temperature-salinity plane. The dashed-dotted black line indicates the freezing temperature at zero pressure, and the vertical dashed lines mark S = 31 and S = 33. (C) and (D) are the same, with the profiles being from September 1992, 2008, and 2015. Heat content (Q, J m−2) relative to the freezing temperature integrated between the isohalines S = 31 and S = 33 is shown in (A) and (C) for the profiles plotted. All profiles are in the vicinity of the diamond shown in the regional map (E), which was free of sea ice in September 2008 and 2015, and ice covered for the other profiles (contours indicate the monthly sea ice edge; 15% concentration); the cyan boundary delineates the BG region.
