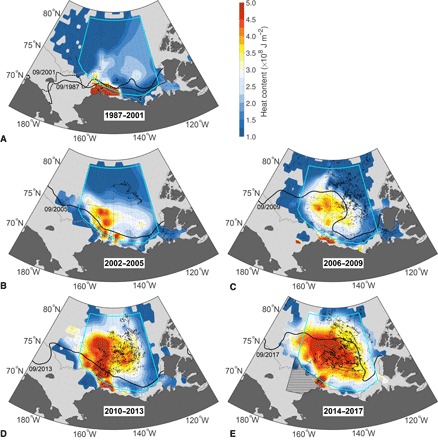
Fig. 2. Maps of heat content in the BG warm halocline.

(A to E) Heat content (J m−2) relative to the freezing temperature integrated between the isohalines S = 31 and S = 33 for all data (including all seasons) in the periods (A) 1987–2001, (B) 2002–2005, (C) 2006–2009, (D) 2010–2013, and (E) 2014–2017. The hatched region in (E) is the NCS region of strongest subduction (see text). The cyan boundary delineates the BG region considered in the time series calculations. The gray bathymetric contour marks the 100-m isobath, and black dots indicate temperature-salinity profile locations. Black contours on each panel indicate the monthly sea ice edge (15% concentration) for the month labeled.
