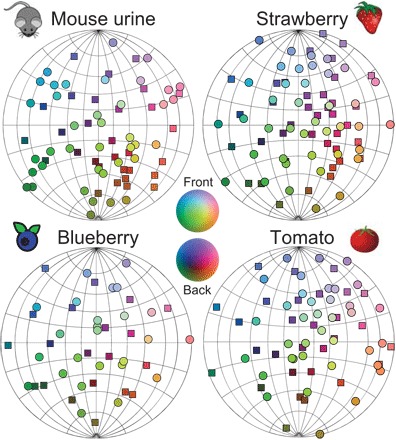
Fig. 3. Visualization of the natural olfactory space using nonmetric MDS.

Because the variation in radius is small, data points are shown on the surface of a sphere with circles/rectangles for points falling on the near/far side of the sphere. The RGB color scales were proportional to the XYZ coordinates of points.
