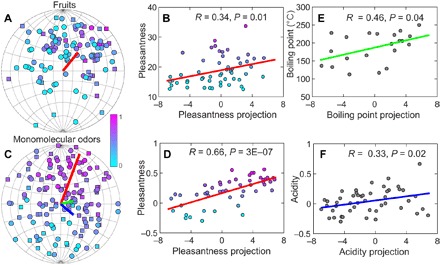
Fig. 4. Axes associated with pleasantness and odor physiochemical properties.

(A) We represented 108 fruit samples (54 tomatoes and 54 strawberries) using normalized linear combinations of odor coordinates in the space, with the weights proportional to odor concentrations in the samples. The color indicates human rating for the overall liking; circles/squares represent points from the front/back sides of the sphere. The red line shows the direction most associated with the pleasantness ratings. (B) The correlation is significant, with correlation value R = 0.34 and P = 0.01. (C) Visualization of 144 individual monomolecular odors. The red, green, and blue lines showed the directions of pleasantness, boiling point, and acidity, respectively. Two-thirds of monomolecular odors were used to determine the directions associated with perceptual or physicochemical properties of odors, and the rest one-third were projected onto the directions as validation sets to evaluate the correlations. In the 144 monomolecular odors, only 62 of them have available boiling points and were used to find the boiling points direction. (D) Correlation between odor pleasantness with projection onto the pleasantness axes. (E) Correlation between molecular boiling point, a measure of odor volatility, with projection on the associated axes. (F) Correlation between acidity value and the associated axes.
