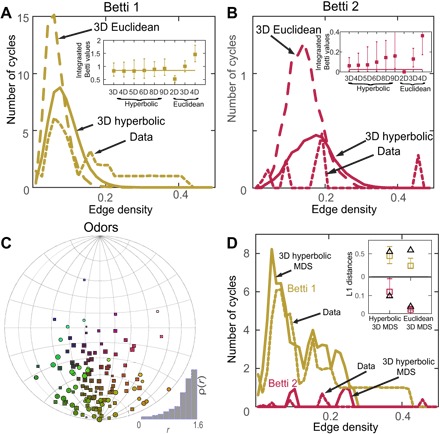
Fig. 5. Hyperbolic organization of the human olfactory perception.

The (A) first and (B) second Betti curves of the perceptual data set (dotted line) (20) compared to Betti curves of the 3D hyperbolic space (solid line) and 3D Euclidean space (dashed line). Euclidean and hyperbolic spaces of other dimensions provided a worse fit. Insets compare integrated Betti values from data (horizontal lines) and 300 repeated models in different dimensions with Euclidean or hyperbolic metrics. The error bars show 95% confidence intervals; the number of repeated computations of model curves was 300. (C) Visualization of odors in human olfactory perception space using nonmetric MDS in a 3D hyperbolic space. The sizes of points are proportional to their radii. The radius distribution is shown in bottom right inset. (D) The multimodal aspects of Betti curves derived from data (dotted lines) can be accounted for by the nonuniform distribution of points within the 3D hyperbolic space. Sampling points from (C) produces multimodal first (yellow) and second (red) Betti curves (solid lines). Inset shows comparison of L1 distances between Betti curves derived from data and those derived from 100 different MDS fits. Black open triangles represent the distance between data and model mean, and colored bar plots show the range of values, where data curves are substituted by different MDS fits.
