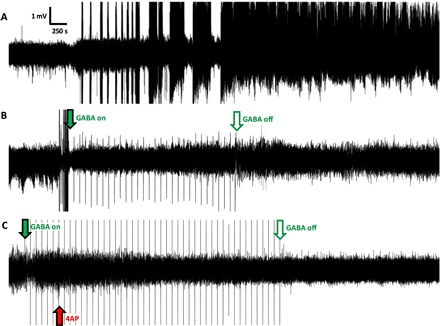
Fig. 2. Representative electrophysiology recordings from the hippocampus.

(A) Recording in the absence of the μFIP treatment with SLEs starting approximately 30 min after 4AP injection followed by status epilepticus. (B) Recording of case in which the μFIP treatment was initiated immediately following the first SLE, showing no further pathological events after the treatment starts. (C) Recording in which the μFIP treatment was initiated before 4AP injection, showing no pathological events. Red arrow indicates 4AP injection. Solid green arrows indicate start of the μFIP treatment, and open green arrows mark the end of the μFIP treatment. Sharp peaks at 100-s intervals following green arrow are artifacts from the μFIP treatment.
