. 2018 Jul 2;9(33):6749–6757. doi: 10.1039/c8sc02446d

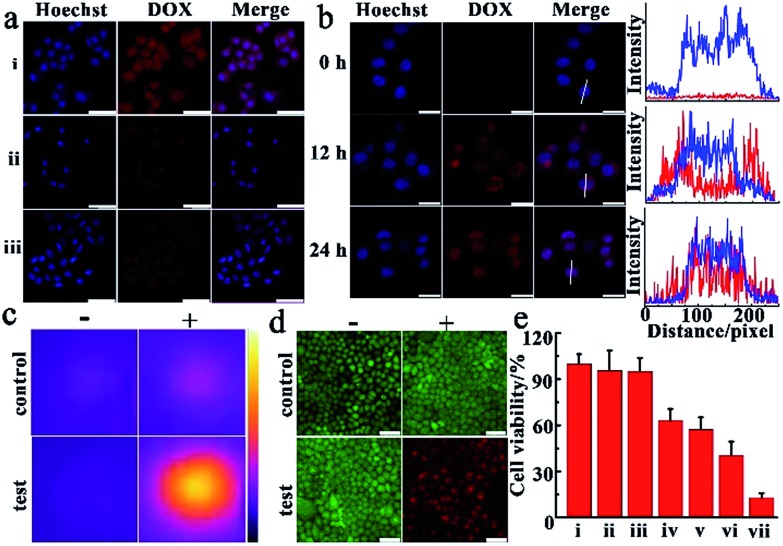
Fig. 4. (a) The CLSM images of HeLa cells and NIH-3T3 cells treated under different conditions, the conditions from top to bottom represent: HeLa cells (i) and NIH-3T3 cells (ii) incubated with the intact nanoagent SiO2@Au@MnO2–DOX/Apt; (iii) HeLa cells incubated with nanomaterials without aptamer modification, SiO2@Au@MnO2–DOX. (b) The CLSM images of HeLa cells incubated with the theranostic nanoagent and observed at different time points. The curves represented the distribution of DOX (red lines) and Hoechst 33342 (blue lines) in HeLa cells. (c), (d) The photothermal images (c) and CLSM images (d) of HeLa cells incubated with culture medium as a control group and the theranostic nanoagent as a test group, (–) no NIR irradiation, (+) NIR irradiation. (e) Cell viability of HeLa cells after different treatments. Group (i) control; group (ii) only NIR irradiation; group (iii) SiO2@gold shell–Apt; group (iv) SiO2@gold shell–Apt with NIR irradiation (PTT); group (v) pure DOX; group (vi) SiO2@Au@MnO2–DOX/Apt (chemotherapy); group (vii) SiO2@Au@MnO2–DOX/Apt with NIR irradiation (chemotherapy/PTT). All scale bars are 75 μm.

Fig. 4