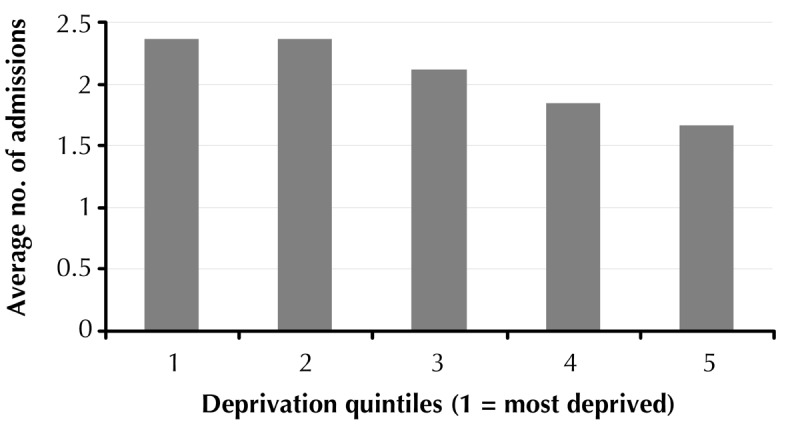
Figure 2. The relationship between the number of admissions and deprivation quintiles.

Quintile 1 is the most deprived and quintile 5 the least deprived area. The figure shows that patients with type 1 diabetes who live in a deprived area are more likely to be admitted.
