
Figure 4.
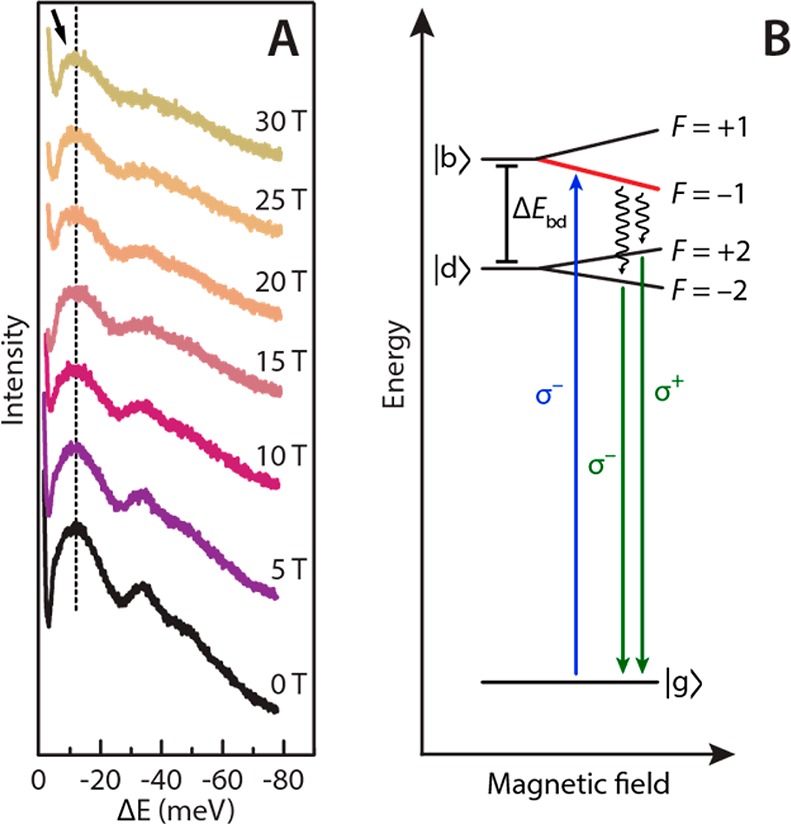
Fluorescence line-narrowing (FLN) spectroscopy at 4 K upon excitation of the bright F = −1 state with σ– light of 2.1 eV. (a) FLN spectra showing the σ+ emission peaks at variable magnetic field. The state at 2.1 eV (the excitation laser energy) is taken as reference and set to 0 meV. The main peak (marked by the dashed line) is due to emission from the F = ±2 states coupled to an acoustic phonon; the other two peaks are related to optical phonon replicas. (b) Energy level scheme showing the bright F = −1 state (marked in red) that is excited (blue arrow) and the emissions from the dark F = ±2 states (green arrows).