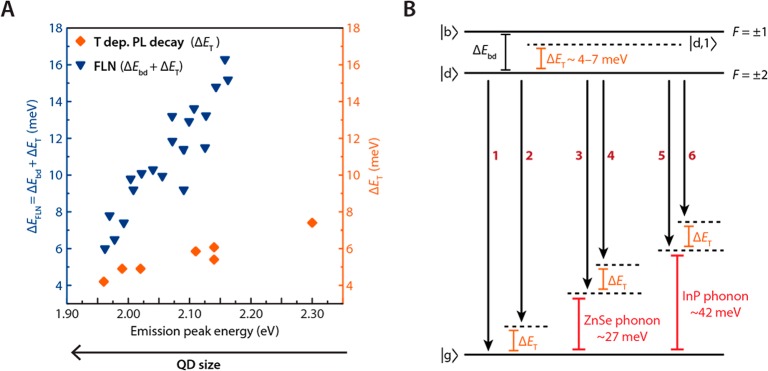
Figure 6.
Comparison of the thermal activation energies obtained from PL decay measurements and the dark–bright splitting obtained from the FLN spectra. (a) Comparison of the results of the activation energy obtained from the time-resolved PL decay at varying T (orange diamonds) and the energy splitting obtained from the fluorescence line-narrowing (blue triangles). The x-axis displays the monitored PL emission peak energy or the emission energy in FLN, both at 4 K. (b) Overview of all possible recombination processes in InP/ZnSe QDs.

