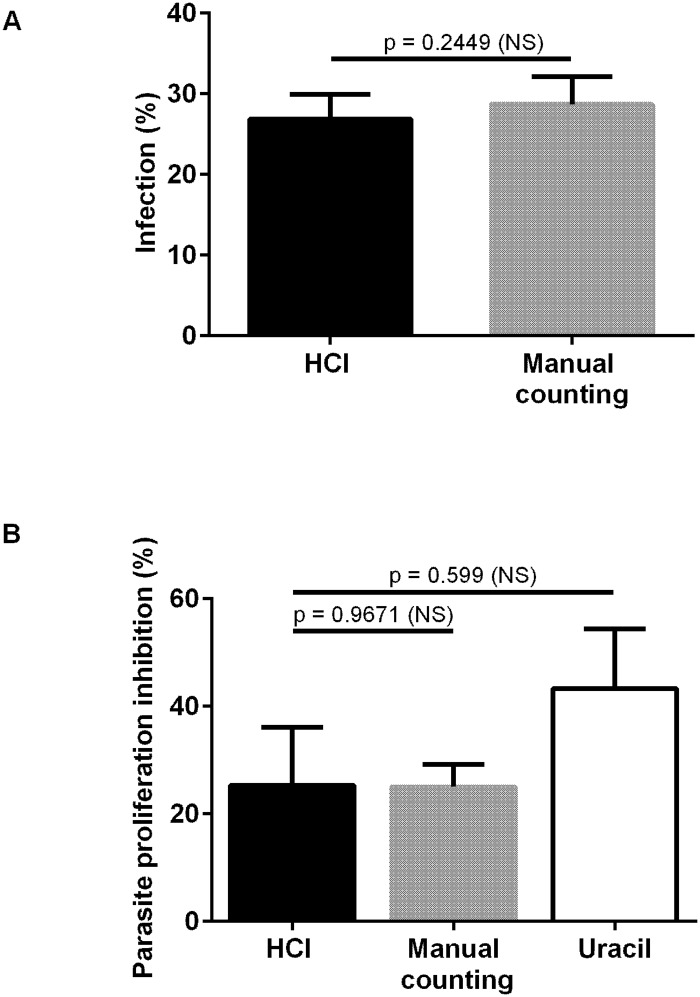
Fig 2. Comparison between the infection- and proliferation rates as determined by the HCI- versus the gold standard assays.
Vacuoles and parasites were counted to determine both the infection- and the parasite proliferation rates. Histograms represent the mean +/- standard deviation of 3 independent experiments. A-Comparison of Toxoplasma infection rates, as determined by the HCI assay versus manual counting. B- Comparison of Toxoplasma proliferation, as determined by the HCI assay versus standard methods, i.e. manual microscopic counting and the [3H]-uracil incorporation assay, respectively.

