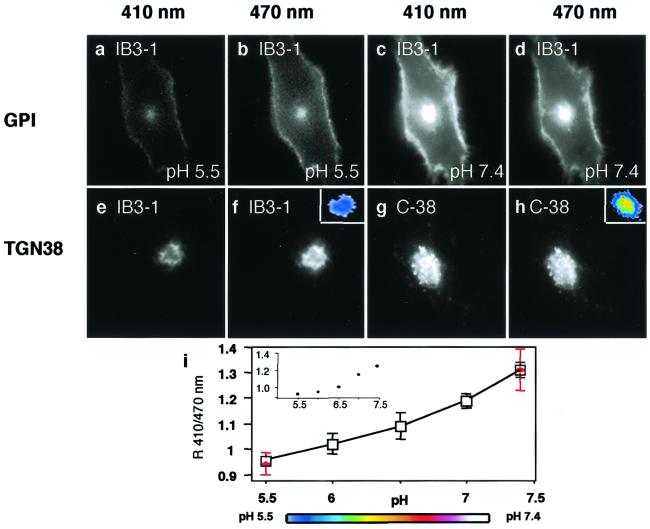
Figure 1.
Fluorescence images of live CF and CFTR-corrected human bronchial epithelial cells expressing GPI and TGN38 fused to pH-sensitive GFP. Cells were excited at 410 or 470 nm as indicated above each column, and fluorescence emission at 508 nm was recorded by fluorescence microscopy. (a–d) IB3–1 transfected with GPI-pHluorin GFP at indicated pH applied externally. (e–h) TGN38-GFP pHluorin transfected CF IB3–1 cells (e and f) and CFTR-corrected C38 (g and h). The external buffer had a pH of 7.4. (Color Insets) pH values according to the color look-up table in i. (i) pH calibration curve was generated two ways: by using GPI-pHluorin GFP and changing the pH of the externally applied buffer, and by generating internal standards (red). The internal standards were obtained with TGN38-pHluorin after data collection by treating cells with 10 μM monensin and 10 μM nigericin at the end of the experiment and changing the pH of the external buffer. The data points are normalized to match the pH of the ratio obtained by using GPI-pHluorin GFP as external standard at 7.4. Dots represent an example of individual data sets.

